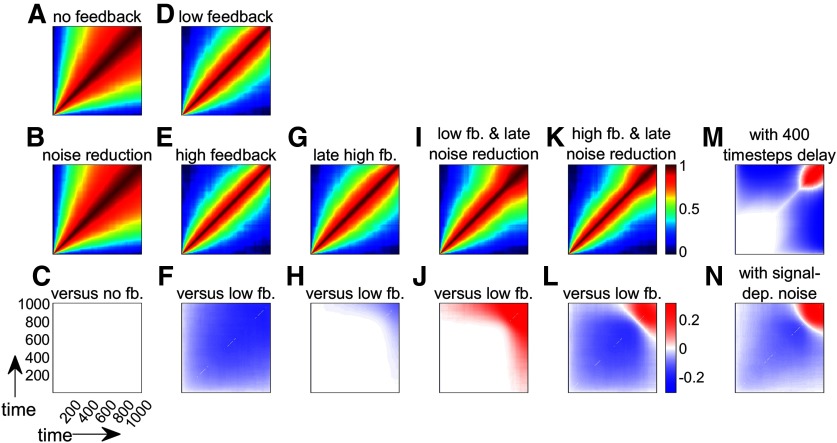
Figure 7.
Simulations of time-time correlation map behavior under different models of the reward- and punishment-based effects on motor execution. A, D, Time-time correlation maps of both control models. Colors represent Fisher-transformed Pearson correlation values. For each map, the bottom left and top right corners represent the start and the end of the reaching movement, respectively. B, E, G, I, K, Time-time correlation maps of plausible alternative models. C, F, H, J, L, Comparison of models with their respective baseline models. M, Same as in L, but with feedback delay of 400 time steps. N, Same as in L, but with a bell-shaped noise term to introduce signal-dependent noise.

