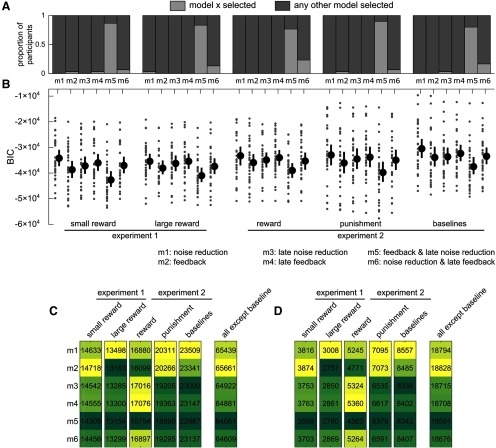
Figure 8.
Model comparisons for individual and group fits. A, Proportion of participants whose winning model was the one considered (light gray) against all other models (dark gray) for every cohort. B, Individual and mean BIC values for each participant and each model. Lower BIC values indicate a more parsimonious model. Dots represent individual BICs. Black dot represents the group mean. Error bars indicate the bootstrapped 95% CIs of the mean. C, Residual sum of squares for group-level fits. Darker colors represent lower values. D, Same as in C, but for BIC. fb, Feedback; noise red., noise reduction.

