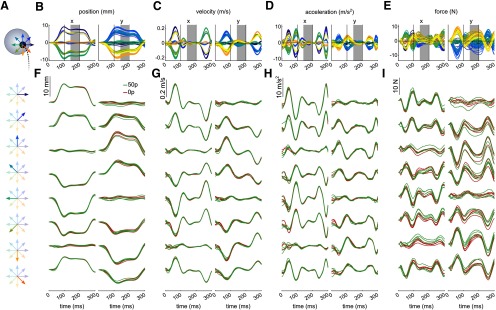
Figure 9.
Displacement profiles at the end of the reach for a single participant. A, Schematic of the displacement. Gray circle represents a target. Black circle represents the cursor. Dashed line indicates the past trajectory. At the end of the movement, when velocity decreased behind a threshold of 0.03 m/s, a displacement occasionally occurred in 1 of 8 possible directions. Colored arrow indicates each direction. B, Position over time during the displacement for a participant. Right and left columns indicate the x and y dimensions, respectively. C, Velocity profile. D, Acceleration profile. E, Force profile. Two vertical black solid lines indicate the limit between the ramp-up and plateau, and plateau and ramp-down phase. Values for each variable were taken as the average over time during the 140-200 ms window (gray area), when the displacement is clamped and most stable. F-I, Details of the displacement profiles for each direction independently. 0 and 50 p trials are also represented in red and green, respectively, for comparison.

