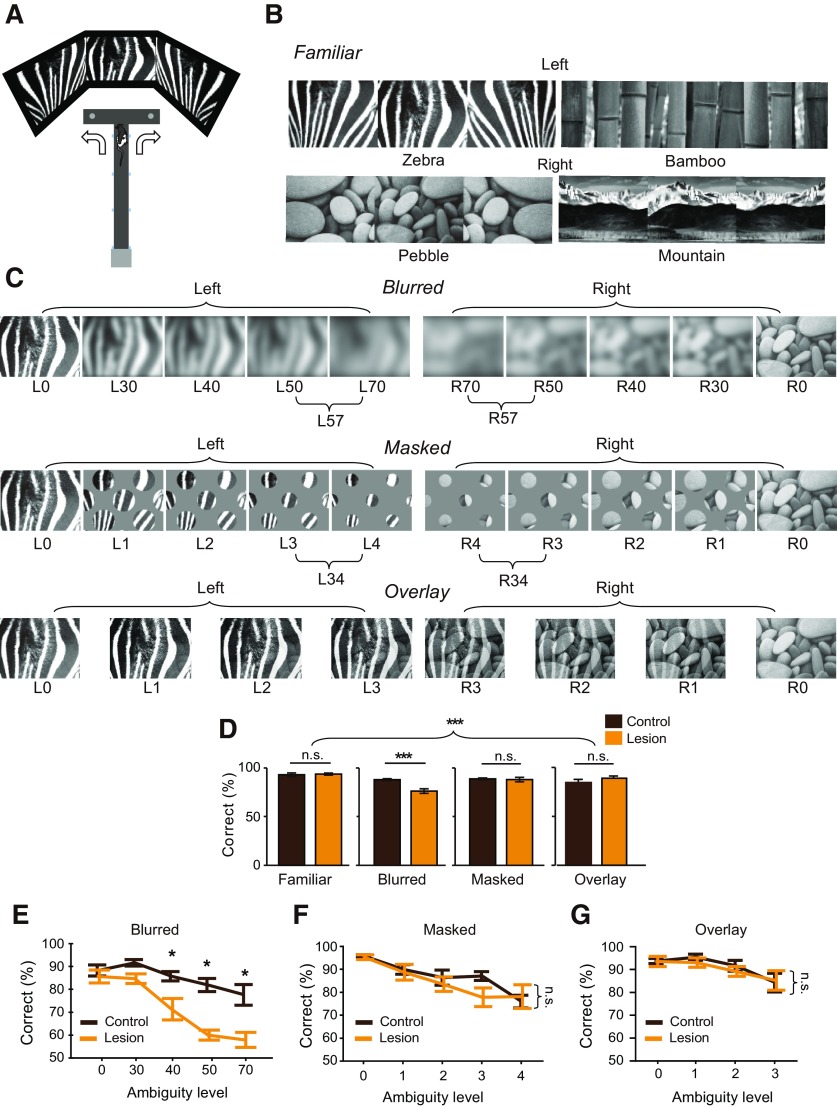
Figure 1.
Behavioral paradigm and performance. A, VSM task. B, Four unaltered familiar visual scene stimuli used in Familiar session. C, Top, Blurred session, using 10 Gaussian blurred scenes. Middle, Masked session, using 10 partially occluded scenes. Bottom, Overlay session, using eight partially mixed scenes. In Blurred and Masked sessions, the higher ambiguity levels were grouped together (L57, R57, L34, and R34) for the electrophysiological analysis to account for a smaller number of correct trials. D, Behavioral performance of the two groups under different scene conditions. Values are given in mean ± standard error (SE). n.s. not significant, *p < 0.05, **p < 0.01, ***p < 0.001. E, Behavioral performance of the two groups across different ambiguity levels in Blurred sessions. Values are given in mean ± SE. F, Same as E, but in Masked sessions. Values are given in mean ± SE. G, Same as E, but in Overlay sessions. Values are given in mean ± SE.

