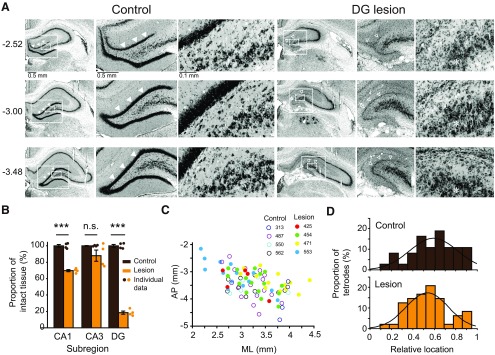
Figure 2.
Histological verification of DG lesions. A, Examples of thionin-stained sections from the control and DG-lesion groups. For each hippocampal section (4× magnification, left), the DG/hilar area (larger rectangle) was zoomed and shown as a magnified image (10× magnification, middle). The suprapyramidal blade of the DG and the hilar area (smaller rectangle) was further zoomed to show changes observed in the DG granule cell layer and CA3 pyramidal cell layer (40× magnification, right). Solid and open arrowheads indicate intact and damaged granule cell layers in the control and lesion groups, respectively. Asterisks in the DG-lesion group denote the relatively intact pyramidal cells in the CA3. Scale bars are shown below the sections. AP coordinates (distances from bregma) are given at the left bottom corners of the sections. B, The extent of the lesion in the hippocampal subregions based on 3D volumetry. Proportions of intact tissue in individual rats are shown in colored dots next to the bar graphs. Values are given in mean ± SE. n.s. not significant, ***p < 0.001. C, Distribution of the AP and ML coordinates of tetrodes. Tetrodes from control rats are depicted as open circles, and those of the DG-lesioned rats are as filled circles. Individual rats are shown in different colors. D, Distribution of the relative locations of the tetrodes in the control and DG-lesion groups. The relative location of 1 denotes the boundary between CA3 and CA2. The black curves denote estimated normal distributions.

