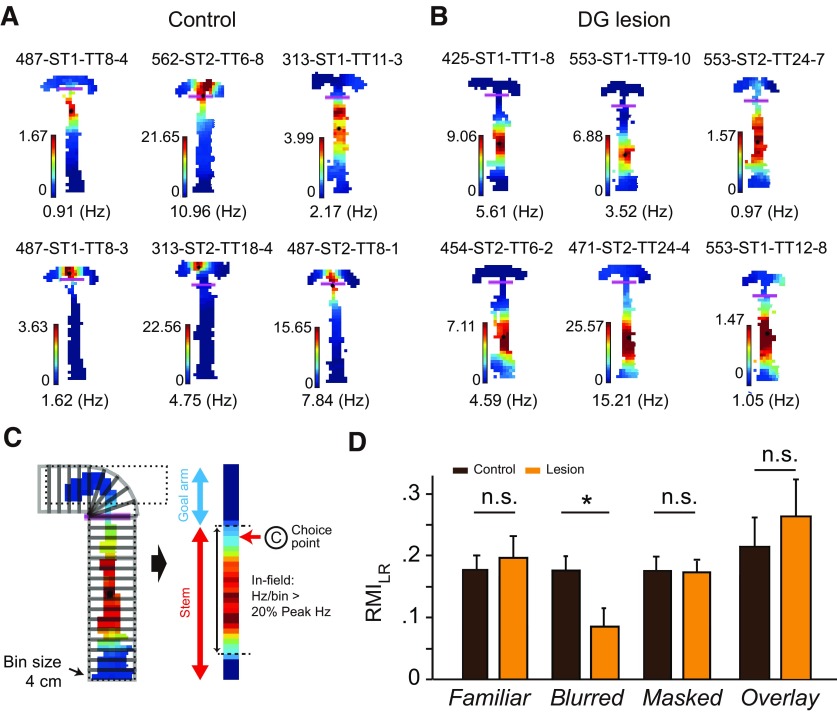
Figure 4.
Scene-dependent rate modulation in the CA3 units. A, Examples of spatial firing patterns of CA3 units with intact DG. Cell identities are marked on top of the unit examples, which denote information about the rat, session, tetrode, and cluster identity of each unit in that order. Numbers on the top of the color bar indicate a peak firing rate. In-field mean firing rates are shown below each spatial firing rate map. Black dots indicate the center of mass of the place field. B, Examples of spatial firing patterns of CA3 units from rats with DG lesions. C, Illustration of the linearization process of a CA3 place field. The choice point was defined as the bin in which the trajectories for the left and right trials differed significantly for at least two consecutive bins. D, Rate modulation index (RMI) between the left and right response-associated scenes in the Familiar, Blurred, Masked, and Overlay sessions. Values are given in the mean ± SE. n.s. not significant, *p < 0.05.

