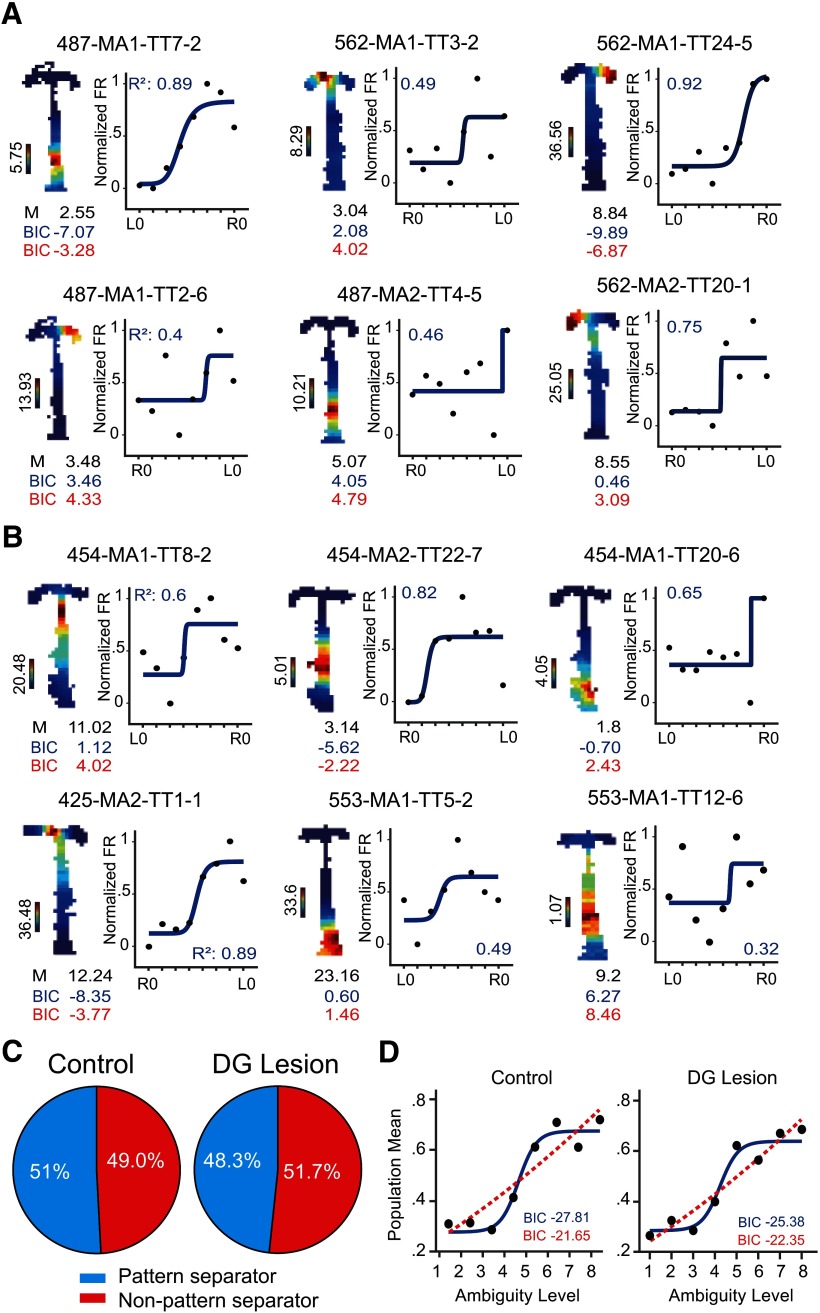
Figure 8.
Scene-dependent rate modulation in the CA3 during retrieval of partially occluded visual scenes. A, Examples of stepwise rate modulation in CA3 units with intact DG, as shown in Figure 6A. Blue lines indicate well fit sigmodal models. BIC values (blue from the sigmoidal model and red from the quadratic model) used for the categorization are shown below the rate map. B, Examples of categorical rate modulation in CA3 units with DG lesions. C, The proportion of units that were better explained by the sigmoidal model (pattern separator-like cells, blue) and by the quadratic model (non-pattern separator-like units, red) in the control and DG-lesion groups during the Masked sessions. D, The population scene-tuning curve from control (left) and DG-lesion group (right) in the Masked sessions. BIC values from the sigmoidal model (blue) and quadratic model (red) are shown below the scene-tuning curve.

