Figure 1.
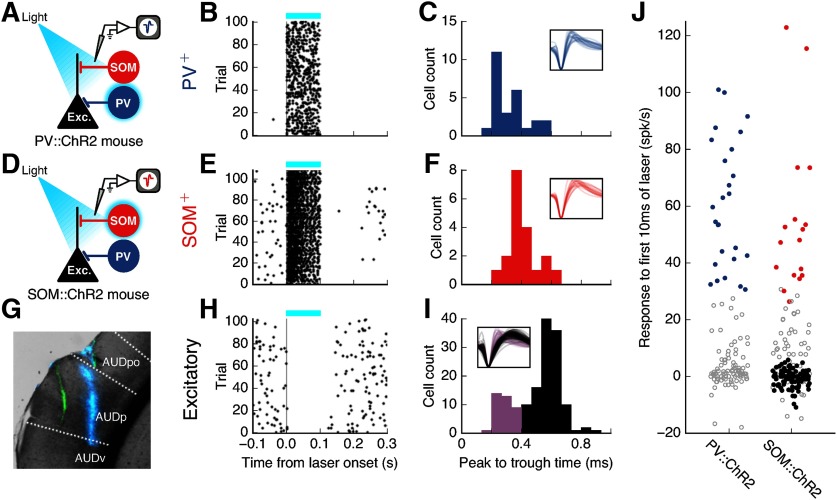
Photoidentification of auditory cortical cell types. A, Identification of PV+ cells in PV::ChR2 mice by their responses to laser stimulation. B, Response of an example identified PV+ cell to 100 ms pulses of blue laser (blue bar). C, Spike widths of all identified PV+ cells (N = 26). Inset, Normalized spike waveforms of all identified PV+ cells. Voltage traces are 1.33 ms long. D, Identification of SOM+ cells in SOM::ChR2 mice by their responses to laser stimulation. E, Response of an example identified SOM+ cell to 100 ms pulses of blue laser (blue bar). F, Spike widths of all identified SOM+ cells (N = 19). G, Coronal brain slice (AP: −3.18 mm) showing two electrode tracks: green (DiO) and blue (DiD). Recordings were performed at multiple sites along each penetration. AUDp, Primary auditory area; AUDpo, posterior auditory area; AUDv, ventral auditory area, according to Allen Mouse Brain Atlas. H, Response of an example putative excitatory cell to 100 ms pulses of blue laser (blue bar). I, Spike widths of all cells that did not have positive responses to laser from SOM::ChR2 animals. Black represents cells classified as putative excitatory cells (N = 116). Purple represents cells with narrow spikes (peak to trough < 0.4 ms, N = 37) which were not classified as putative excitatory cells. J, Laser-evoked change in firing for all frequency-tuned cells (N = 122 from PV::ChR2 mice, 204 from SOM::ChR2 mice) during the first 10 ms of the laser pulse. Blue represents identified PV+ cells. Red represents identified SOM+ cells. Black represents putative excitatory cells. Gray represents cells not falling into any of the above three categories. PV+ and SOM+ cells were identified by their positive, low-latency responses to blue laser (p < 0.001, Wilcoxon rank-sum test). Two SOM+ cells with laser-induced firing rates of >200 Hz are not shown.

