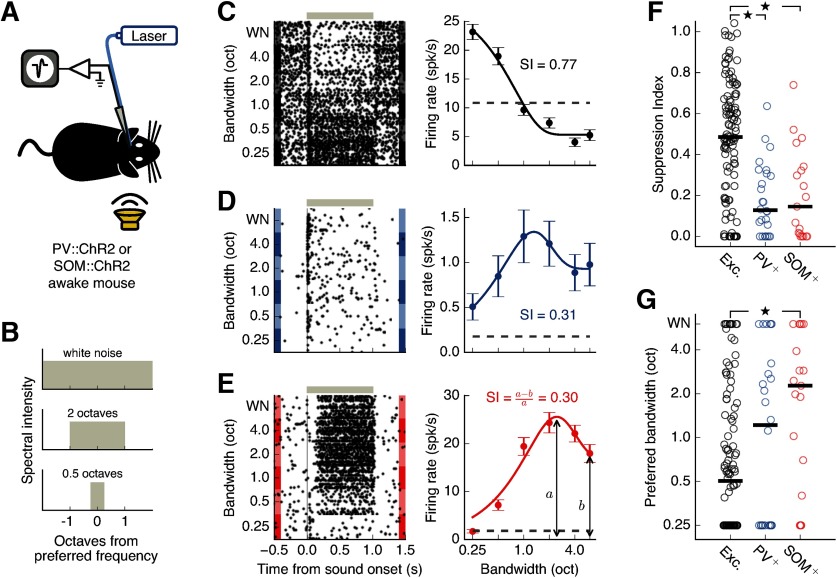
Figure 2.
Inhibitory interneurons in auditory cortex exhibit less spectral surround suppression than excitatory neurons. A, Setup for electrophysiological recordings from the auditory cortex during contralateral sound presentation. B, Frequency spectra of auditory stimuli used to estimate bandwidth tuning. C, Left, Response of the example putative excitatory cell depicted in Figure 1H to amplitude-modulated sounds of different bandwidths. Gray bar represents the sound duration. Right, Bandwidth tuning curve of the sustained response (200-1000 ms after sound onset). Dashed line indicates spontaneous firing rate. Error bars indicate SEM. This cell shows a typical surround-suppressed response: lower firing for high bandwidth stimuli than for low bandwidth stimuli. D, Same as in C for the PV+ cell depicted in Figure 1B. E, Same as in C for the SOM+ cell depicted in Figure 1E. F, Spectral surround suppression for all recorded putative excitatory (N = 116), PV+ (N = 26), and SOM+ cells (N = 19). Black bars represent medians. Inhibitory cells were significantly less suppressed than excitatory cells (excitatory PV+ p = 5.9 × 10⁻⁶, excitatory SOM+ p = 0.00039, PV+-SOM+ p = 0.863, Wilcoxon rank-sum test). G, SOM+ cells reach their peak firing rates at significantly higher bandwidths than excitatory cells (excitatory PV+ p = 0.327, excitatory SOM+ p = 0.0083, PV+-SOM+ p = 0.260, Wilcoxon rank-sum test). Black bars represent medians. *p < 0.017 (α value adjusted for multiple comparisons).

