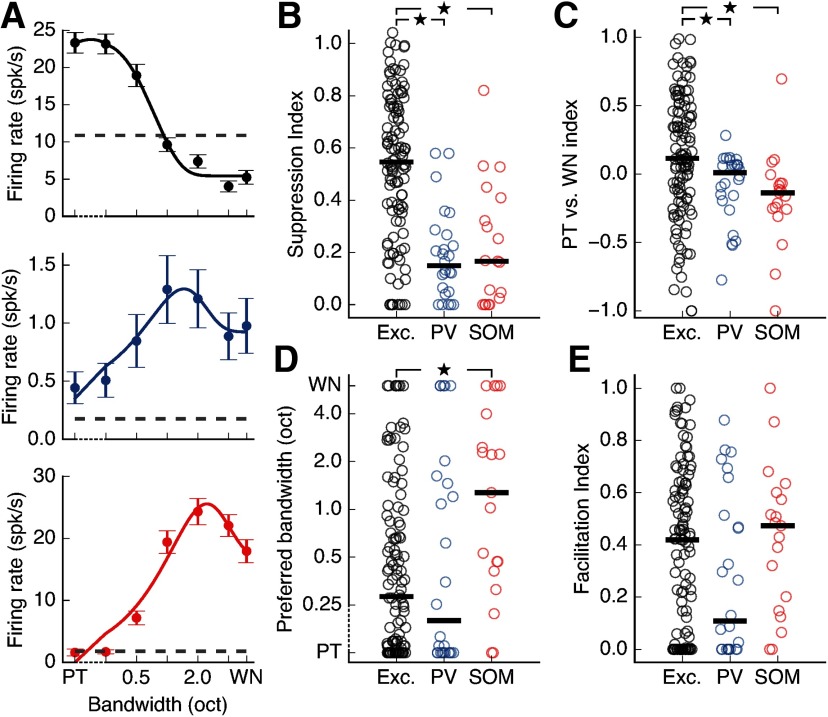
Figure 3.
Inclusion of PT stimuli in analysis of suppression does not affect results. A, Bandwidth tuning curves for the cells depicted in Figure 2C-E when including responses to PTs (bandwidth = 0). Our estimation of suppression for these cells is minimally affected by the inclusion of these data points. Dashed axis indicates that data points from 0 (PT) to 0.25 octaves are plotted on a linear scale. B, Spectral surround suppression for all cells depicted in Figure 2F when responses to PTs are included in the calculation of SI. Inhibitory cells still show significantly less suppression than excitatory cells (excitatory PV+ p = 1.9 × 10⁻⁷, excitatory SOM+ p = 5.3 × 10⁻⁵, PV+-SOM+ p = 0.918, Wilcoxon rank-sum test). Black bars represent medians. C, When comparing responses to PTs and WN, excitatory cells show a significantly higher preference for PT stimuli compared with PV+ or SOM+ cells (excitatory PV+ p = 0.0088, excitatory SOM+ p = 0.0026, PV+-SOM+ p = 0.113, Wilcoxon rank-sum test). A positive index indicates that the cell had a larger response to PTs than WN. Black bars represent medians. D, The differences in preferred bandwidth seen in Figure 2G remain consistent when responses to PTs are taken into account (excitatory PV+ p = 0.920, excitatory SOM+ p = 0.0044, PV+-SOM+ p = 0.056, Wilcoxon rank-sum test). Dashed axis indicates that data points from 0 (PT) to 0.25 octaves are plotted on a linear scale. Black bars represent medians. E, There is no significant difference across cell types in facilitation of responses by increasing bandwidth (excitatory PV+ p = 0.187, excitatory SOM+ p = 0.498, PV+-SOM+ p = 0.089, Wilcoxon rank-sum test). Black bars indicate medians. *p < 0.017 (α value adjusted for multiple comparisons).

