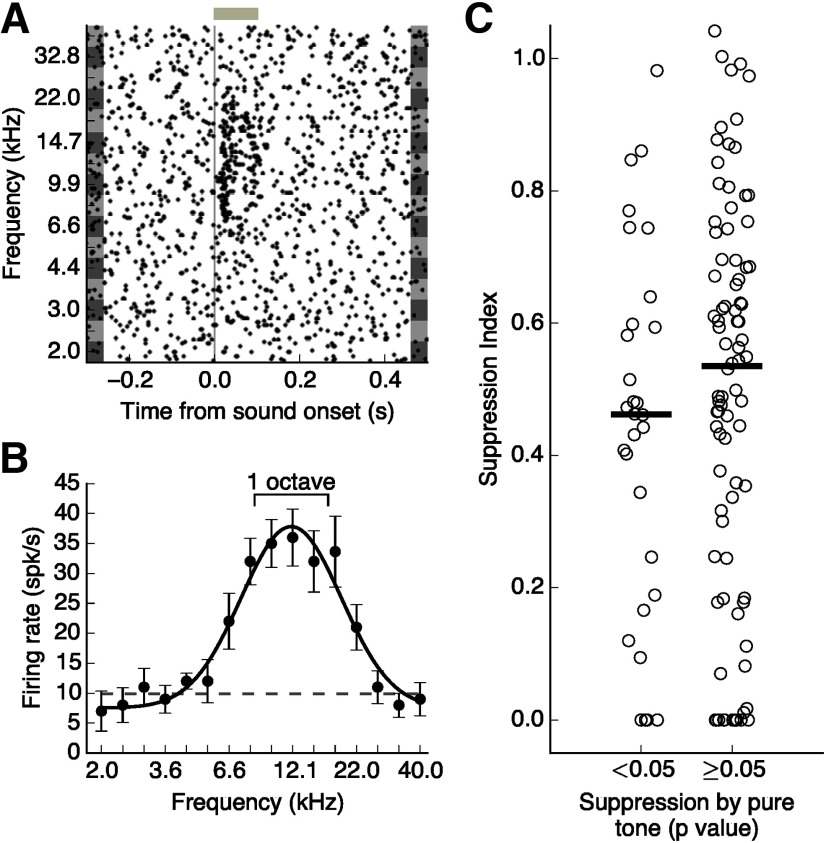
Figure 4.
Surround suppression cannot be explained by suppression by PTs. A, Response of the putative excitatory cell depicted in Figure 2C to PTs of different frequencies. Gray bar represents sound duration (100 ms). B, Frequency tuning curve of cell shown in A. Error bars indicate SEM. Dashed line indicates the cell's spontaneous firing rate. Scale bar represents the range of frequencies in a sound stimulus with a bandwidth of one octave centered on the estimated preferred frequency. Although each individual frequency in this range elicits a positive response in this cell, the ensemble of these stimuli leads to a suppressed response (Figure 2C). C, Spectral surround suppression for all recorded putative excitatory cells (N = 116), split by whether any PT elicited a significant suppression below baseline (p < 0.05, Wilcoxon rank-sum test). Black bars represent medians. Suppression did not significantly differ between the two groups (p = 0.298, Wilcoxon rank-sum test).

