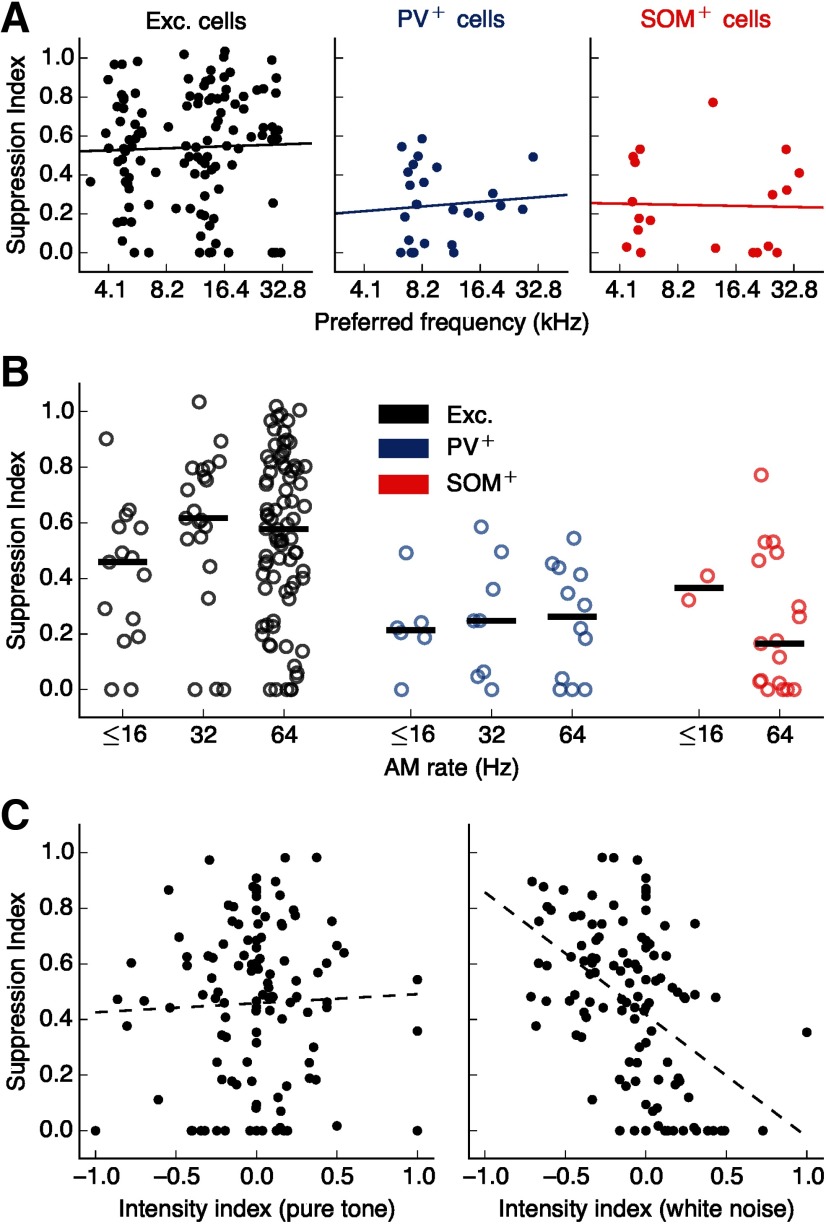
Figure 5.
Surround suppression cannot be explained by other factors. A, SI was not correlated with preferred frequency (excitatory: r = 0.032, p = 0.730; PV+: r = 0.085, p = 0.681; SOM+: r = −0.028, p = 0.908). Lines indicate linear regressions. B, Differences in surround suppression across cell types cannot be explained by the stimulus modulation rates used (excitatory p = 0.108, PV+ p = 0.832, SOM+ p = 0.350, Kruskal–Wallis test for effect of AM rate on SI within each cell type). C, Left, There was no statistically significant correlation between surround suppression and intensity tuning for PTs (r = 0.039, p = 0.683). A negative intensity index means the low-intensity PT elicited a higher sustained response than the high-intensity PT. Line indicates a linear regression. Right, Intensity tuning for WN is negatively correlated with surround suppression (r = –0.477, p = 9.1 × 10⁻⁸, linear regression).

