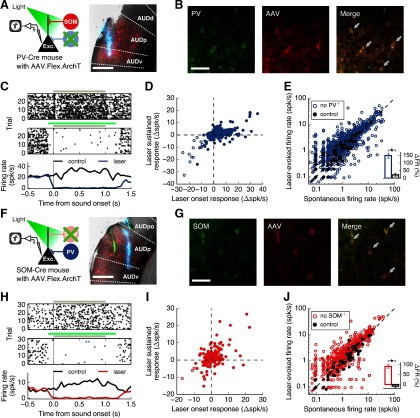
Figure 7.
Inactivation of inhibitory cells in the auditory cortex. A, Left, Recordings from auditory cortex during photoinactivation of PV+ cells. Right, Coronal brain slice (AP: −2.35 mm) showing an electrode track (blue, DiD) and the extent of virus expression at the recording location (red, tdTomato) in a PV-Cre mouse. Scale bar, 500 μm. AUDp, Primary; AUDd, dorsal; AUDv, ventral; AUDpo, posterior auditory areas. B, Confirmation of transfection specificity. Cells labeled with an antibody against PV (left) expressed ArchT-tdTomato (center) as indicated by the arrows (right). Scale bar, 50 μm. C, Response of a cell from a PV-Cre mouse to a 0.25 octave sound stimulus alone (top), or paired with laser (middle). Gray bars represent sound duration. Green bar represents laser duration. This cell is strongly inactivated by the laser. D, Change in firing rates of all sound-responsive cells from PV-Cre mice (N = 543 cells) at laser onset (first 50 ms) versus during sustained laser presentation (300-1100 ms after laser onset). The cells whose responses were significantly suppressed at laser onset (open dots, N = 16 cells) remained suppressed for the duration of the laser stimulus. E, Laser-induced firing rates (50 ms before sound onset) of single units were higher than spontaneous firing rates when laser was directed at the auditory cortex (blue points, N = 1324 cells, p = 2.3 × 10–54, Wilcoxon signed-rank test), but not when laser was directed away (black points, N = 147 cells, p = 0.064, Wilcoxon signed-rank test). Inset, Directing the laser at the auditory cortex led to a stronger change in firing rate compared with the control condition (p = 3.5 × 10– 8, Wilcoxon rank-sum test). Error bars indicate SEM. F, Left, Recordings from auditory cortex during photoinactivation of SOM+ cells. Right, Coronal brain slice (AP: −3.18 mm) showing electrode tracks (blue represents DiD; green represents DiO) and the extent of virus expression at the recording location (red, tdTomato) in a SOM-Cre mouse. Scale bar, 500 μm. G, Cells labeled with an antibody against SOM (left) expressed ArchT-tdTomato (center) as indicated by the arrows (right). Scale bar, 50 μm. H, Same as in C for an example cell from a SOM-Cre mouse. I, Same as in D, but for all sound-responsive cells from SOM-Cre mice (N = 373). Cells showing significant suppression at laser onset (open dots, N = 3) remained suppressed for the duration of the laser stimulus. J, Same as in E for SOM-Cre mice. Laser-induced firing rates were higher than spontaneous firing rates when laser was directed at the auditory cortex (red points, N = 809 cells, p = 1.0 × 10⁻³⁰, Wilcoxon signed-rank test), but lower in the control condition (black points, N = 78 cells, p = 0.015, Wilcoxon signed-rank test). Inset, Directing the laser at the auditory cortex led to a stronger change in firing rate compared with the control condition (p = 3.9 × 10⁻⁹, Wilcoxon rank-sum test). *p < 0.05.

