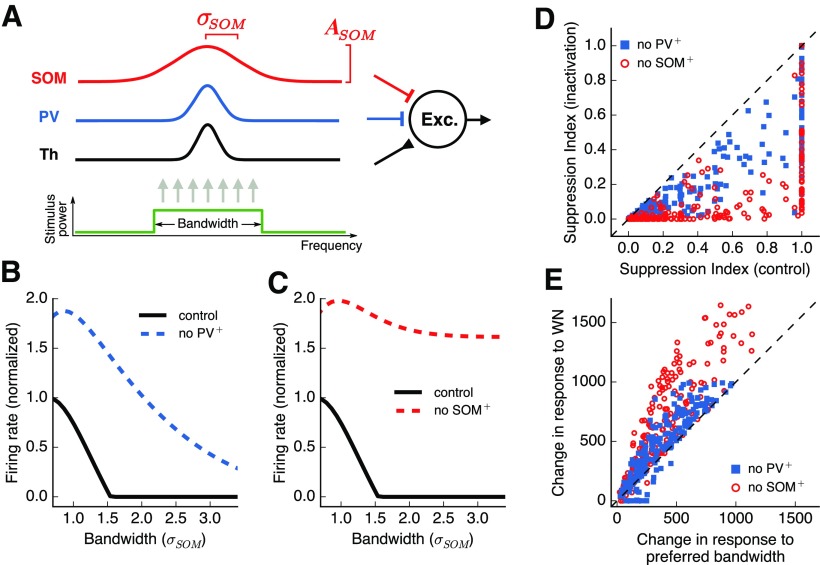
Figure 9.
A feedforward model accounts for the distinct roles played by inhibitory cell types in surround suppression. A, A simulated output excitatory neuron receives three types of inputs weighted by Gaussian profiles. Integration across frequency channels for the SOM+ input is twice as wide as the integration for PV+ input. B, Responses of the output neuron for stimuli of different bandwidths. Inactivation of PV+ input results in an increase in responses without major changes in surround suppression. C, Inactivation of SOM+ input results in a large decrease in surround suppression. D, SI for each simulated output neuron, with and without inactivation of inhibitory inputs. Change in SI is consistently larger for SOM+ inactivation. E, Change in response to preferred bandwidth and to WN stimuli, with and without inactivation of inhibitory inputs (values expressed in arbitrary model response units). The change in response to WN stimuli is consistently larger than the change for preferred bandwidth during SOM+ inactivation, but not PV+ inactivation.

