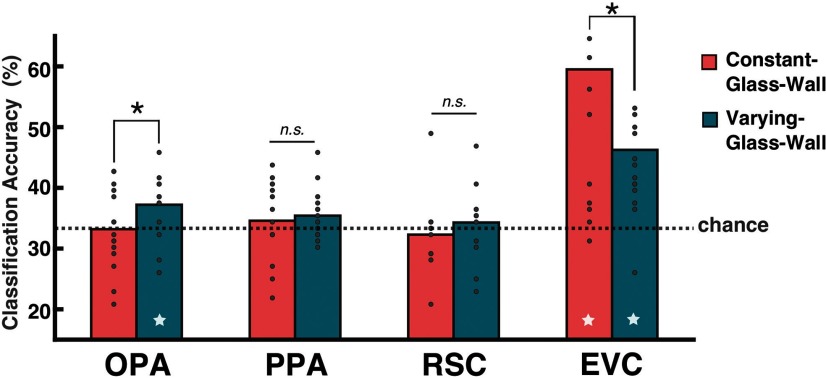
Figure 4.
The SVM classification results in Experiment 2. The y-axis shows the mean classification accuracy (%), and the dotted line marks the chance level of three-way classification (0.33). The bar graph represents the mean accuracy, and gray dots on top of the bar represent individual subject data. The star at the bottom of a bar indicates above-chance classification accuracy. The OPA showed above-chance classification for the Varying-Glass-Wall condition (p < 0.05), where the navigational distance was different, but the chance-level classification performance for the Constant-Glass-Wall condition, where the navigational distance was identical. The EVC also showed significant classification accuracy for the Varying-Glass-Wall condition (p < 0.01), but it showed the above-chance accuracy for the Constant-Glass-Wall condition as well (p < 0.01), where the navigational distance was kept the same. *P < 0.05; n.s. indicates not significant.

