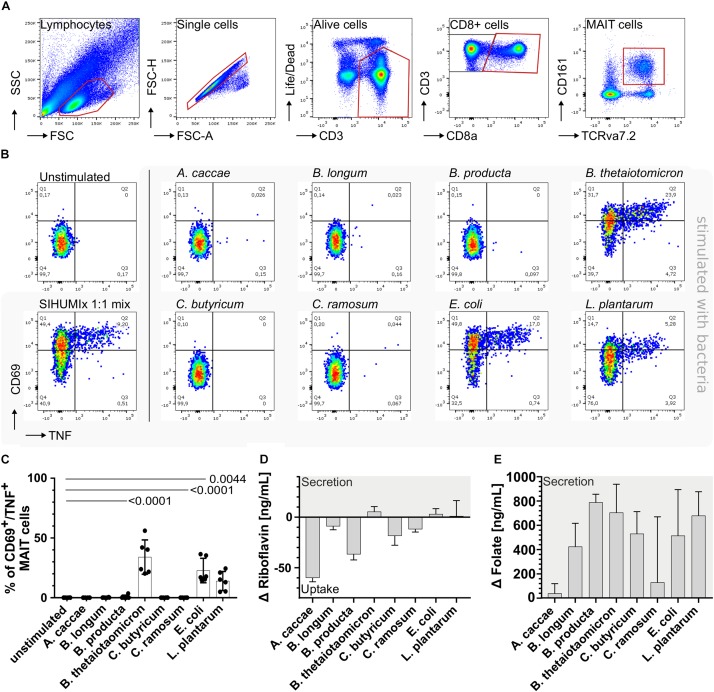
FIGURE 1.
Stimulation of mucosal-associated T (MAIT) cells with individual community members of SIHUMIx. (A) We identified MAIT cells as alive CD3+, CD8+, CD161+, and TCRvα7.2+ from single cell lymphocytes. (B) We defined activated MAIT cells by the expression of CD69+/TNF+ and show exemplary dot plots of unstimulated MAIT cells and MAIT cells after stimulation with the individual SIHUMIx strains [25 bacteria per cell (BpC)]. Moreover, we mixed the individual SIHUMIx strains in equal cell number (SIHUMIx1:1 mix) for stimulation (25 BpC). (C) Bar plots quantify the percentage of activated CD69+/TNF+ MAIT cells after stimulation with the individual SIHUMIx strains compared to the unstimulated control. Bars represent mean ± sd, n = 6, ordinary one-way ANOVA, unpaired, Dunnett’s multiple comparison test. The riboflavin (D) and folate (E) concentrations were measured in the culture supernatant of SIHUMIx after cultivation in Brain-Heart Infusion (BHI) medium [ng/mL]. Bars represent mean ± sd, n = 3. Positive changes indicate vitamin secretion, negative values indicate vitamin uptake.

