
Fig. 2.
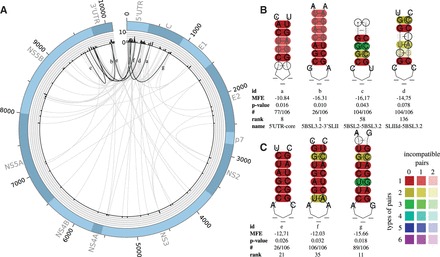
(A) Plot of all predicted LRIs with (74) found in the HCV alignment of 106 sequences. The outer circle represents the genome. The histogram represents the number of LRIs per alignment position. High reactive genome positions can be found in the 5′/3′ UTR and the coding region of the core gene C. The inner circle shows all predicted interactions between all genome positions. Gray—all new LRIs; black—LRIs corresponding to B and C. The plot was created with Circos (Krzywinski et al., 2009). (B) Experimentally verified LRIs, which can be predicted by LRIscan, named SLIIId-5BSL3.2 (Romero-López and Berzal-Herranz, 2009, 2012), 5BSL2-5BSL3.2 (Romero-López et al., 2014; Tuplin et al., 2012), 5BSL3.2-3′SLII (Friebe et al., 2005) and 5′ UTR-core (Beguiristain et al., 2005; Honda et al., 1999). (C) Highly interesting new LRIs predicted by LRIscan. In a former study, we suggested that LRI 2e could be a seed interaction for a HCV genome circularization (Fricke et al., 2015). A complete list including all predicted LRIs can be found at the supplementary page. Colors are used to indicate conserved base-pairs: from red (no variation of a base-pair within the alignment) to purple (all six base-pair types are found); from dark (all sequences contain this base-pair) to light colors (1 or 2 sequences are unable to form this base-pair). Compensatory mutations are marked by a circle around the variable base(s) (Color version of this figure is available at Bioinformatics online.)