
Fig. 5.
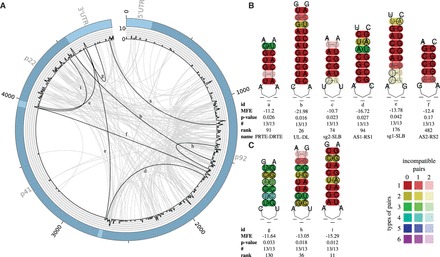
(A) Plot of all predicted LRIs with (213) found in the Tombusvirus alignment of 13 sequences. The outer circle represents the genome. The histogram represents the number of LRIs per alignment position. The inner circle shows all predicted interactions between all genome positions. Gray—all new LRIs; black—LRIs corresponding to B and C. The plot was created with Circos (Krzywinski et al., 2009). (B) Experimentally verified LRIs, which have been also predicted by LRIscan, named SL3-SLB (Fabian and White, 2004, 2006; Nicholson and White, 2008), PRTE-DRTE (Cimino et al., 2011), UL-DL (Wu et al., 2009), sg2-SLB (Fabian and White, 2004), AS1-RS1 (Lin and White, 2004) and AS2-RS2 (Lin and White, 2004). (C) Highly interesting new LRIs predicted by LRIscan. A complete list including all predicted LRIs can be found at the supplementary page (Color version of this figure is available at Bioinformatics online.)