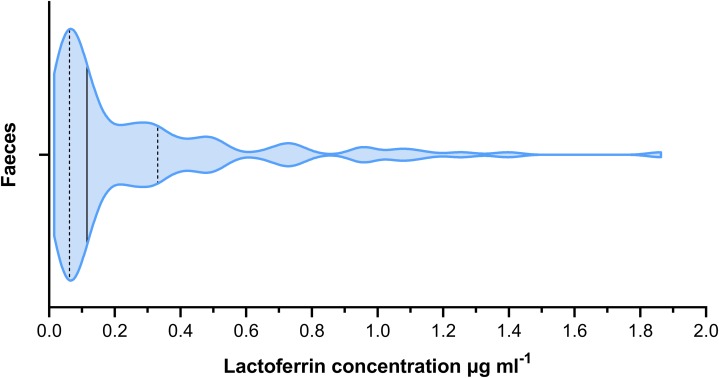
Figure 2. Violin plot showing the distribution of faecal lactoferrin concentrations (µg mL−1) of faecal samples from cattle (n = 115).
The solid black line indicated the median value. The two dashed lines represent the 1st and 3rd quartiles respectively. The width of the plot at any given point represents the frequency of values in that region of the plot.

