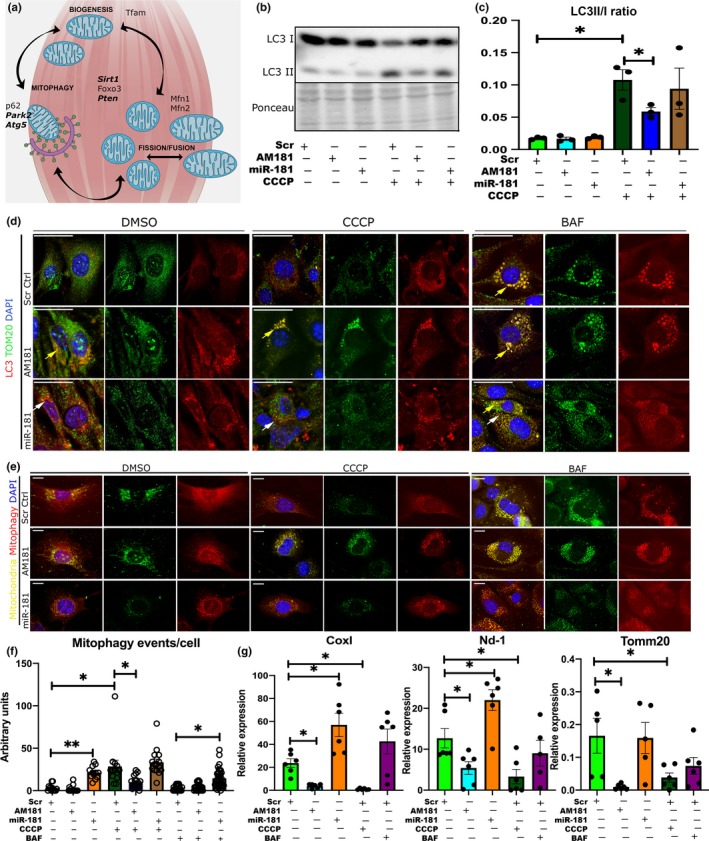
Figure 3.

miR‐181a regulates mitochondrial dynamics in vitro. (a) Schematic representation of putative and validated (in bold) miR‐181a targets associated with mitochondrial dynamics. (b, c) LC3 I/II Western blot and quantification of LC3II/I ratio of C2C12 myoblasts following transfections with scrambled antagomiR, miR‐181a mimic, or antagomiR‐181 and CCCP treatment. (d) Immunostaining of C2C12 myoblast transfected with scrambled antagomiR (control), miR‐181a mimic, or antagomiR‐181a for LC3 and the mitochondrial marker TOM20 following DMSO, CCCP, or BAF treatments. Yellow arrows indicate accumulation of LC3B + TOM20+ punctae, and white arrows indicate LC3‐positive punctae. Scale bars show 30 µm. Representative images are shown. (e) Assessment of mitophagic flux in C2C12 cells treated with scrambled antagomiR (control), miR‐181a mimic, or antagomiR‐181a in control (DMSO) or cells treated with CCCP or BAF using mito‐QC construct. Mitochondria are labeled with mCherry and GFP; upon mitophagy induction, GFP signal is quenched. Scale bars indicate 10 µm. (f) Quantification of mitophagic events per cell through analysis of colocalization of red punctae only. (g) qPCR analysis of mitochondrial gene expression (Cox I, Nd‐1, and Tomm20) in C2C12 myoblasts following DMSO, CCCP, and BAF treatments and transfected with scrambled antagomiR (control), miR‐181a mimic, or antagomiR‐181a, respectively, expression relative to β2‐microglobulin shown. Error bars show SEM; *p < .05 Student's t test
