Figure 6.

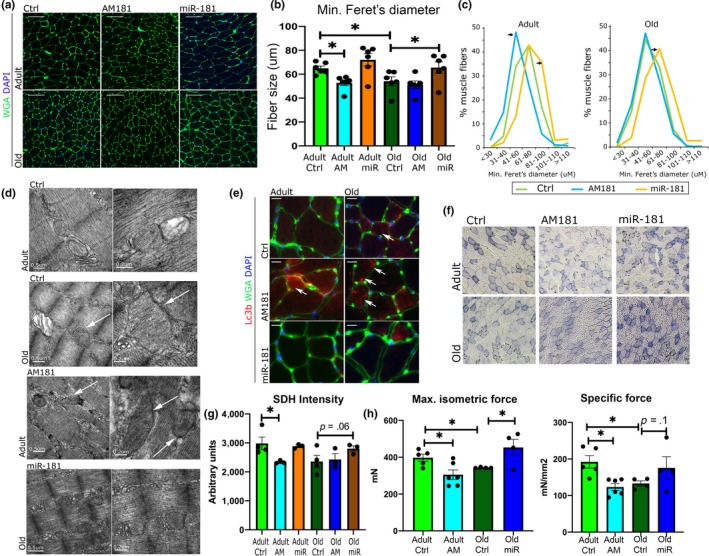
miR‐181a regulates myofiber size and muscle strength in vivo. (a–c) The effects of miR‐181a on myofiber size in adult and old mice. WGA immunostaining (a), quantification of minimal Ferret's diameter (b), and fiber distribution analysis (c) of TA of adult and old mice following intravenous injection of miR‐181a mimic, antagomiR, or saline (control). Scale bars indicate 100 µm; arrows indicate statistically significant changes in fiber distribution (chi‐square test, p < .05). n = 6; *p < .05 unpaired Student's t test. (d) Representative EM images of TA from adult and old mice. Arrows indicate abnormal mitochondria. Scale bars: 0.5 and 0.2 µm. (e) Inhibition of miR‐181a expression in vivo leads to the presence of more of LC3‐positive myofibers (red), n = 3; arrows indicate LC3‐positive fibers. (f, g) Histological examination of miR‐181 effects on mitochondria: SDH staining and quantification (f) of TA of adult and old mice following miR‐181 mimic, antagomiR‐181, or saline injections, respectively. Scale bars indicate 200 µm; n = 3. (h) Muscle maximum and specific force following miR‐181a gain and loss of function in vivo evaluated in EDL muscles from adult and old mice; error bars indicate SEM; n = 4–6
