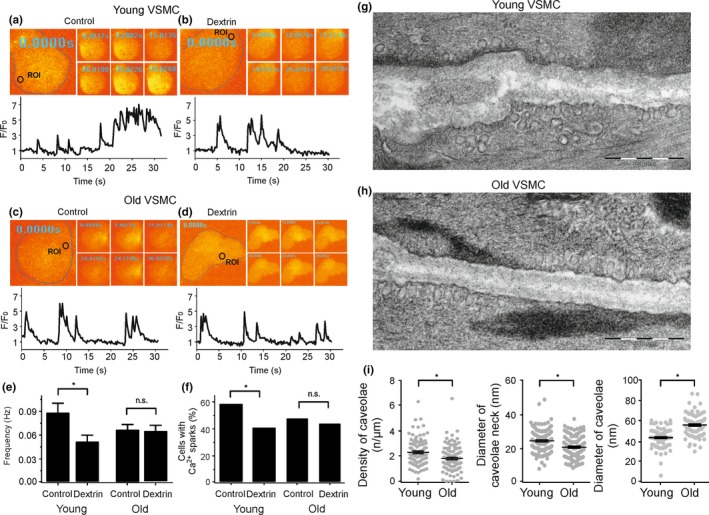
Figure 3.

Defective CaV3.2‐RyR axis in aged VSMC result from alterations in the ultrastructure of caveolae. (a), Ca2+ fluorescence images of a Fluo‐4‐AM–loaded VSMC from a young mouse and time course of Ca2+ fluorescence changes in the cellular ROI (upper panel). Cell boundary is marked with dashed line. (b), same as (a) but with a cell incubated with methyl‐ß‐cyclodextrin (10 mM, 90 min at room temperature) to disrupt caveolae. (c), same as (a) but with VSMCs from old mice. (d), same as (c) but with a cell incubated with methyl‐ß‐cyclodextrin. (e, f), summary of the results. Ca2+ spark frequency (e) and fraction of cells producing Ca2+ sparks (f) in VSMCs from young mice (n = 98), in VSMCs from young mice cells incubated with methyl‐ß‐cyclodextrin (n = 111), in VSMCs from old mice (n = 121), and in VSMCs from old mice cells incubated with methyl‐ß‐cyclodextrin (n = 128). Cells were isolated from 4 mice in each group; 25–40 cells were recorded and analyzed from each mouse. (g), Electron microscopy image of a young VSMC. (h), same as (g) but from old VSMC. (i), summary of the results. Caveolae density, diameter of caveolae neck, caveolae size in VSMCs from young versus old mice (10–20 cells from each mouse, 4 mice in each group). *, p < .05. n.s., not significant
