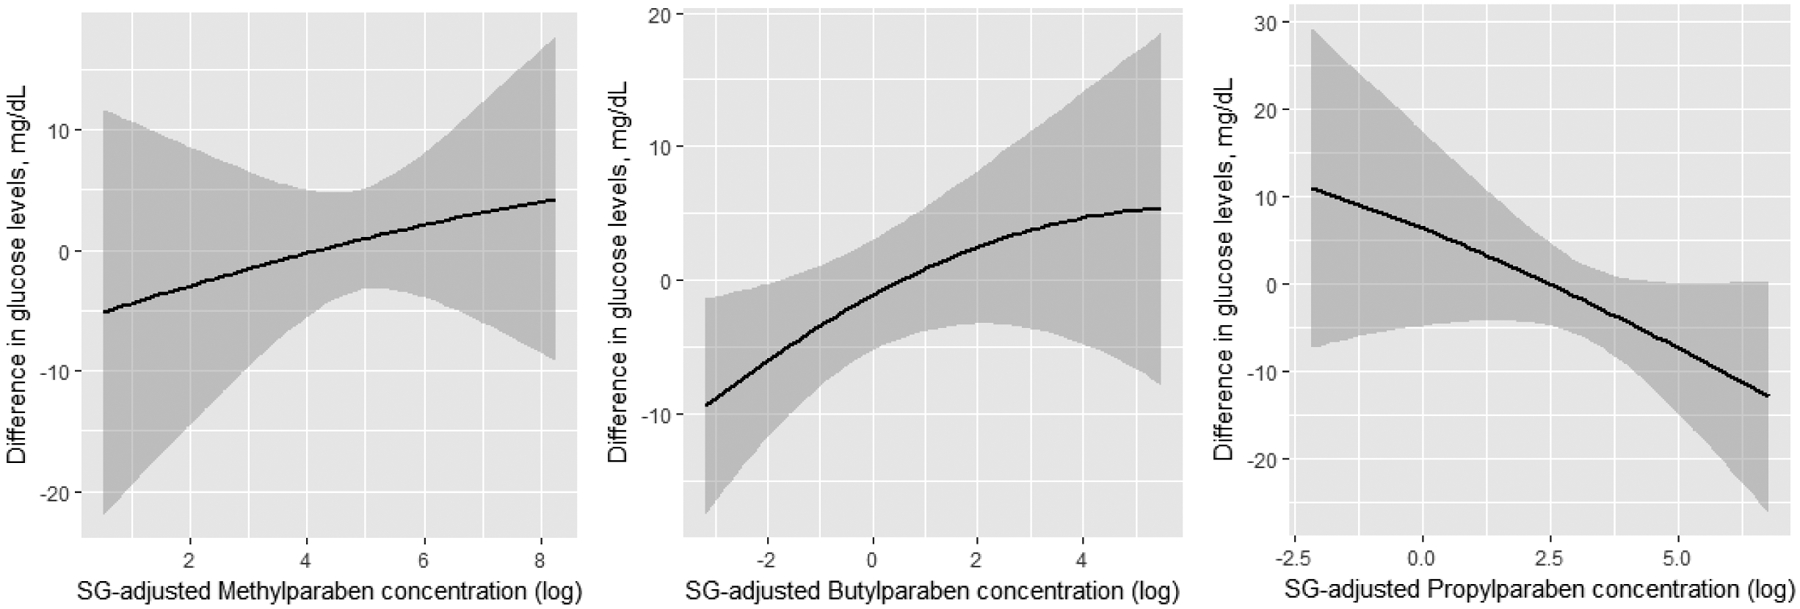
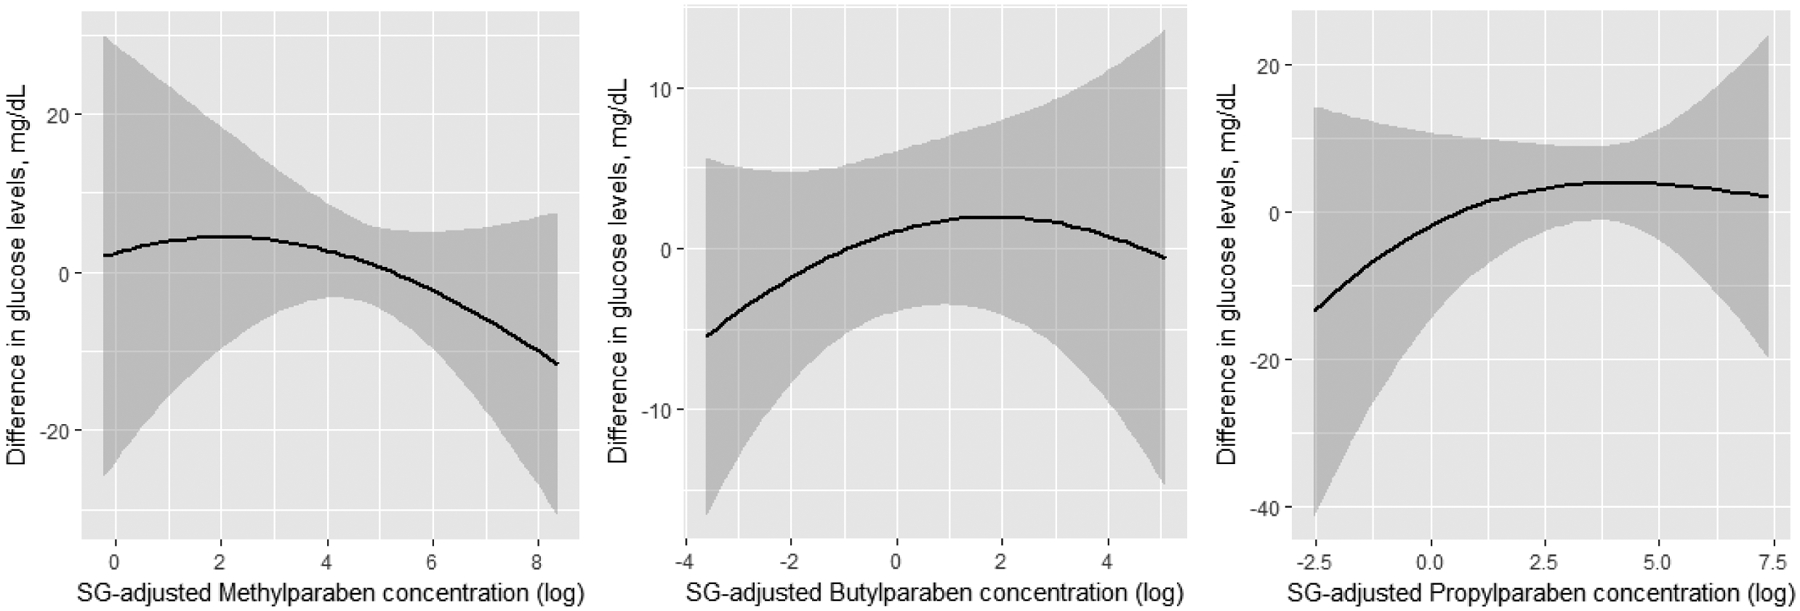
Figure 1.


Dose-response associations between urinary parabens concentration (log-transformed and SG adjusted) at 1st (panel A) and 2nd (panel B) trimester, and later 2nd trimester glucose levels. Results obtained by running Bayesian Kernel Machine Regression (BKMR) for the mixture of parabens further adjusting for physical activity (continuous), maternal age (continuous), BMI (continuous), smoking, race, education, infertility diagnosis, number of fetuses.
