
Fig 3.
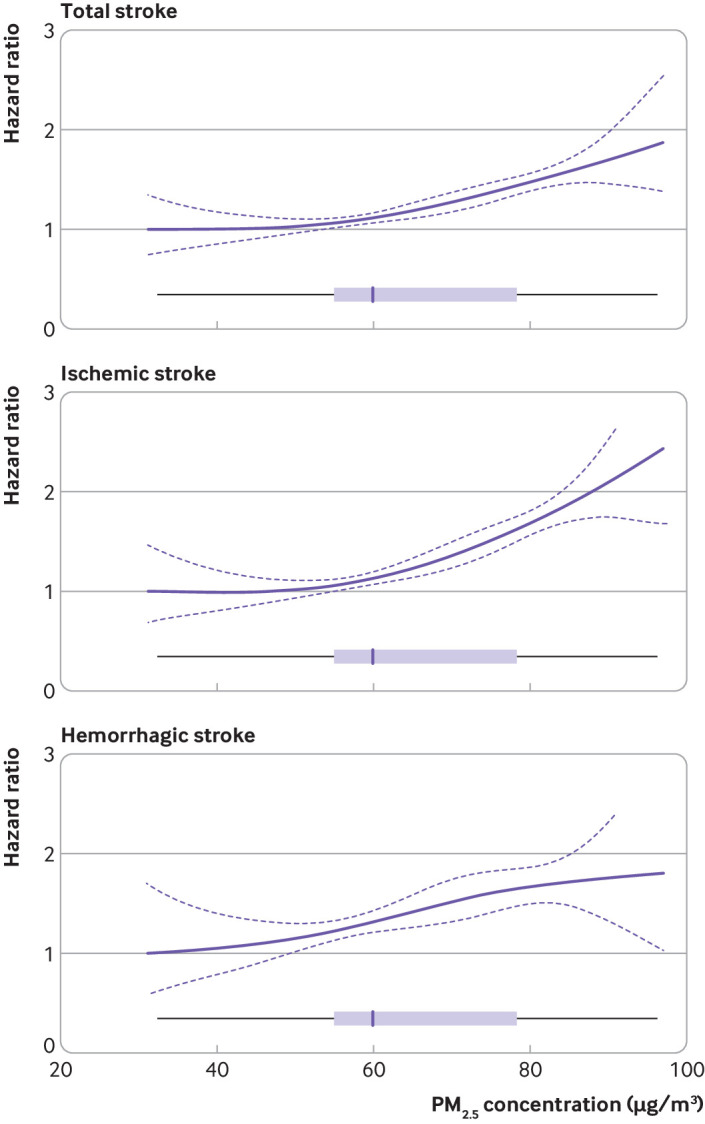
Exposure-response relations between long term exposure to fine particulate matter of diameter ≤2.5 μm (PM2.5) and incidence of total stroke, ischemic stroke, and hemorrhagic stroke among Chinese adults, using a penalized spline function with two degrees of freedom. Hazard ratios were estimated by comparing to a reference value of 31.2 μg/m3. Solid line represents point estimate and dashed lines represent 95% confidence intervals. Boxplot represents distribution of PM2.5 exposure levels for participants