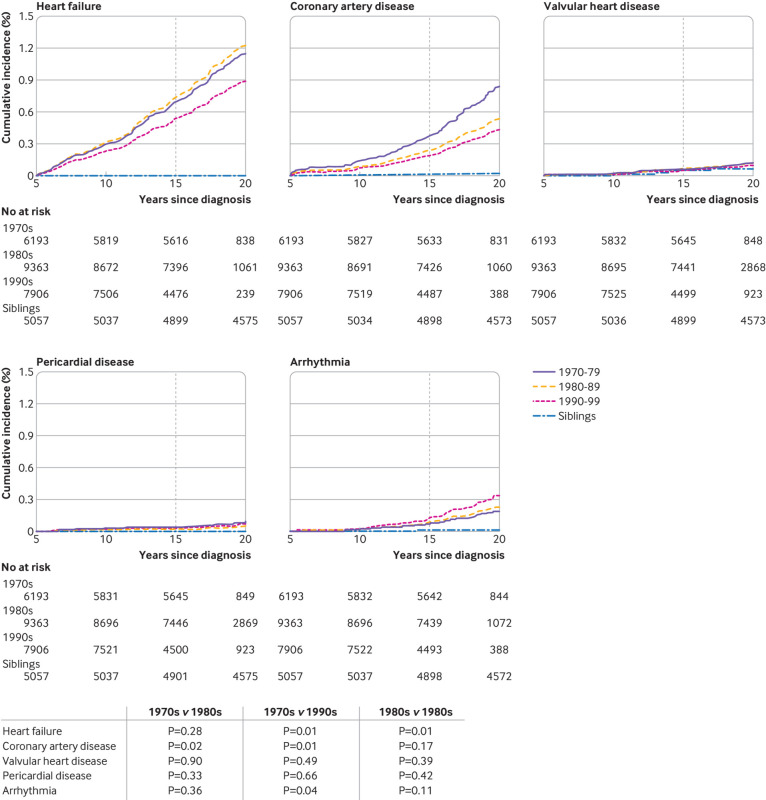
Fig 2.
Cumulative incidence of grades 3-5 cardiac outcomes among survivors of cancer in childhood by decade of cancer diagnosis and siblings. Vertical line represents incidence at 15 years from cancer diagnosis (10 years from cohort entry). P values of permutation tests comparing each outcome by decade. Some survivors were censored before reaching 15 years from diagnosis and thus only contributed to the estimation of cumulative incidence curves up to their censoring time

