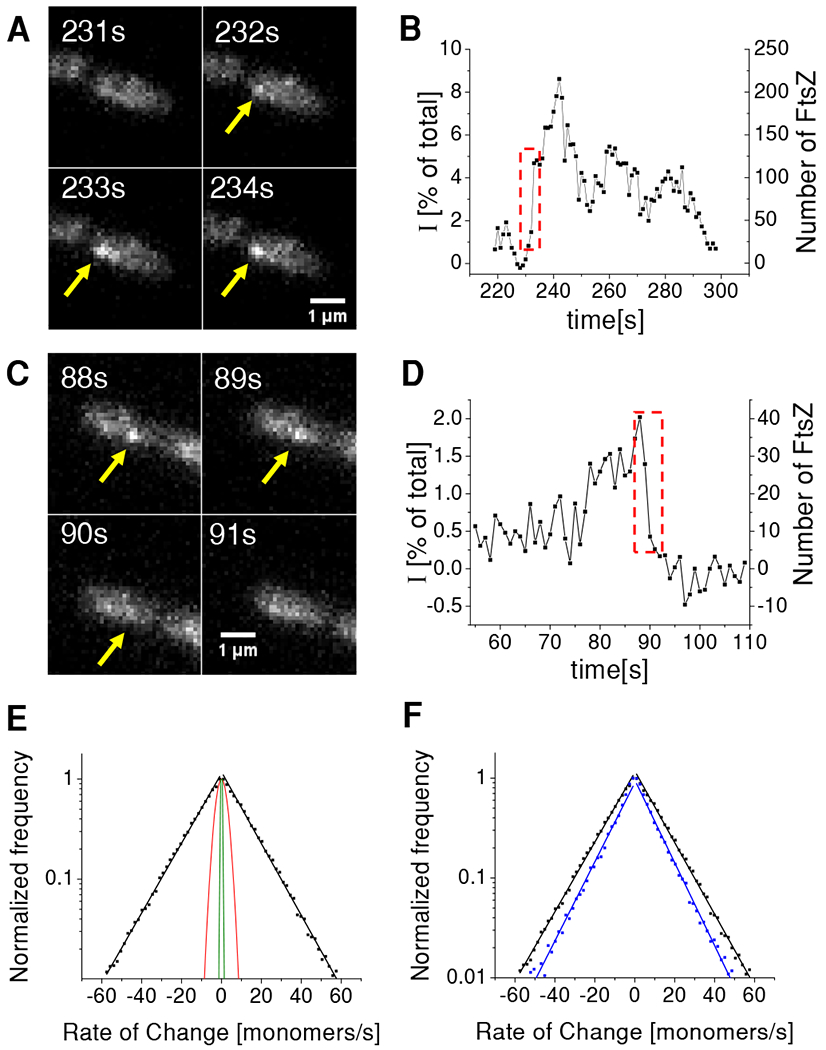
Figure 4. Rate of change in the size of FtsZ transient assemblies.

(A) Time-lapse images of a cell with an assembly that rapidly increases in size.
(B) Corresponding intensity time-trace from this assembly. Left axis shows intensity of the assembly relative to the total intensity of FtsZ-sfGFP from the cell. Right axis corresponds to the absolute number of fluorescent FtsZ-sfGFP in the assembly. Dashed box region corresponds to frames in panel (A). For calibration of right axes see Figure S4 and Methods for details.
(C) Time-lapse images of a cell with an assembly that rapidly decreases in size.
(D) Corresponding time-trace from this assembly. Dashed box region corresponds to frames in panel (C).
(E) Distribution of rates for cell population (Ncell=199; Ncluster=1973) plotted on logarithmic scale (black squares). Each side of the distribution was fitted to an exponential (black solid lines). The characteristic rates from the fitting is 15.6 monomeres/s for addition and 15.7 monomers/s for FtsZ removal. Red solid line represents the prediction of a model where assemblies change in size via treadmilling which include only monomer addition and removal (see Methods for details). Green line is the estimated distribution of the measurement noise (see Methods for details).
(F) Comparison of rates from WT (black) and ΔzapA strains (blue). The latter distribution has a characteristic monomer addition rate of 10.1/s and monomer removal rate of 10.3/s. WT data is from strain KC606 and ΔzapA from strain BEW2.
