
Figure 1.
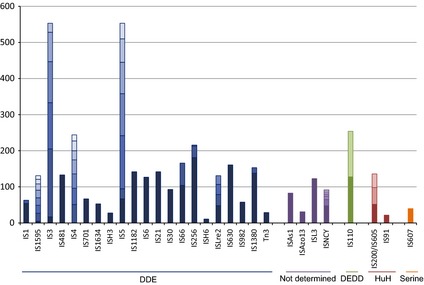
Distribution of IS families in the ISfinder database. The histogram shows the number of IS of a given family, as defined in the text, in the ISfinder database (June 2013). The horizontal boxes indicate the number and relative size of different subgroups (see Table 1 for the subgroups names) within the family. They are grouped by colour to indicate the type of Tpase used: DDE, blue; undetermined, purple; DEDD, green; HUH, red; Serine, orange.