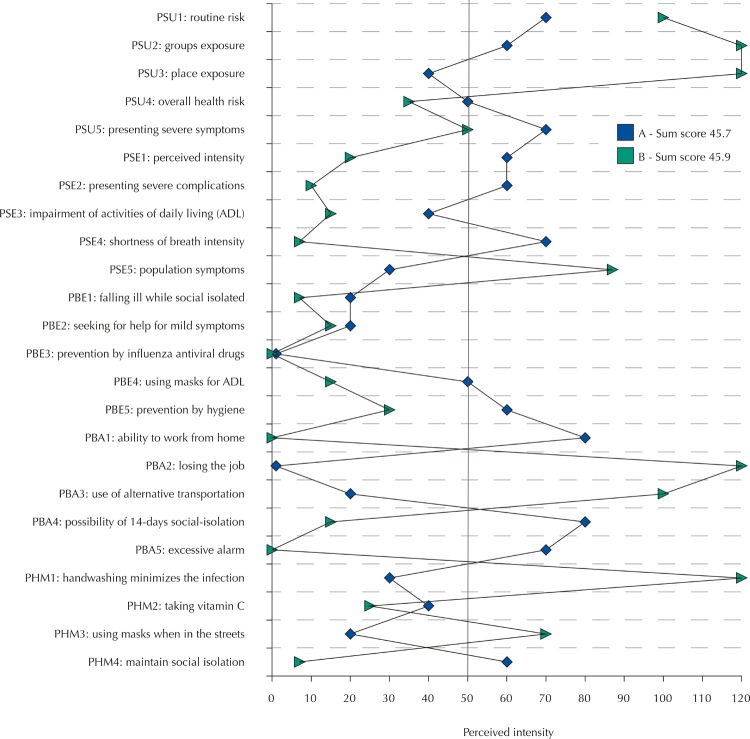
Figure 2. Representation profile on the belief of coronavirus infection (causing covid-19) for classification in centiMax scale ® units (Cmax) of the intensity of risk perception for two people with very similar sum scores (A = 45.7 and B = 45.9 units; risk chance self-declared as high). Vertical line at 50 units indicates a “high” infection risk perception on the scale (see Figure 1).
PSU: perceived susceptibility; PSE: perceived severity; PBE: perceived benefits; PBA: perceived barriers; PHM: pro-health motivation. The numbers represent the question numbers for each model dimension. Values are in units of the centiMax scale ® .

