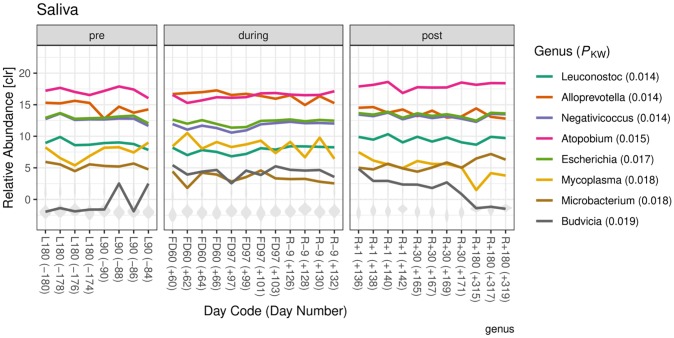
Fig 3. Relative abundances of genera that were differentially abundant among flight state in saliva samples.
The relative abundances of the eight genera with the smallest Kruskall-Wallis P-values are shown in color. The distribution of relative abundances from other genera are shown in grey. Abundances are log transformed and relative to the geometric mean abundance per sample using genera that were present within each flight state (centered log-ratio transform).

