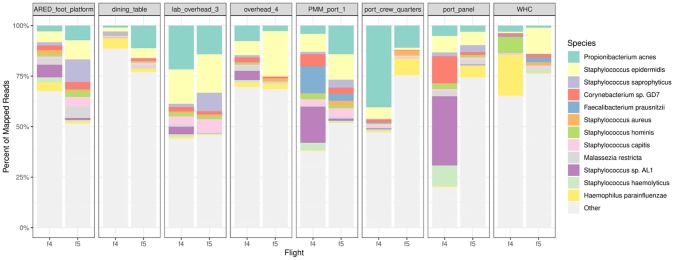
Fig 4. Relative abundances of top 12 species in environmental samples in Flights 4 and 5.
The proportion of mapped microbial reads assigned to each genus is shown for each environmental sample. The top 12 genera are shown in colors and light grey (ranked by the average abundance in each panel summed across locations). Other less abundant genera are lumped together in lighter grey.

