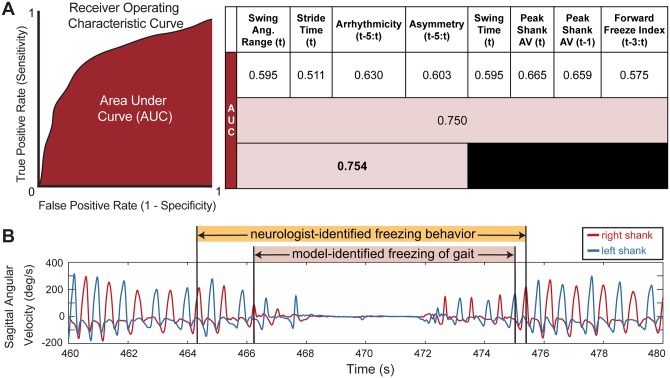
Fig 5. Logistic regression model performance for different gait parameters.
A: overall model performance: AUC values for different model iterations using leave-one-out cross validation on the freezer group. First row: individual gait parameters; second row: all gait parameters; third row: sparse parameter set chosen from regularization. Peak Shank AV = Peak Shank Angular Velocity. Some metrics are calculated over a window of steps in time: “t-3:t” represents a window from “t-3” or 3 steps earlier, to and including the current step “t”. B: representative shank angular velocity traces from right and left legs; model-identified freezing events (pink shading) and neurologist-identified freezing behavior (orange shading).

