
. 2009 May 12;14(4):495–503. doi: 10.1111/j.1440-1843.2009.01517.x
© 2009 The Authors. Journal compilation © 2009 Asian Pacific Society of Respirology
This article is being made freely available through PubMed Central as part of the COVID-19 public health emergency response. It can be used for unrestricted research re-use and analysis in any form or by any means with acknowledgement of the original source, for the duration of the public health emergency.
Figure 3.
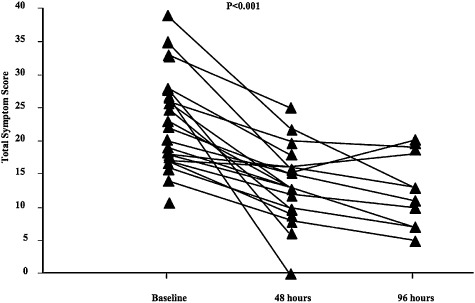
Changes in total symptom scores over the surveillance period.