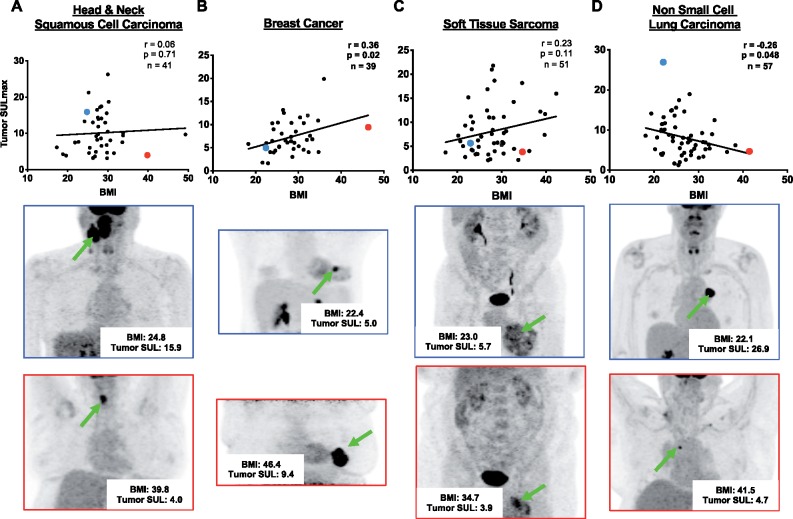
Figure 1.
Body mass index vs lean body mass corrected-glucose uptake. Correlations between body mass index (BMI) and lean body mass-corrected maximized standardized uptake value (SULmax) in tumors of (A) head and neck squamous cell carcinoma, (B) breast cancer, (C) soft tissue sarcoma, and (D) non-small cell lung carcinoma. A lean representative subject is highlighted in blue in the scatter plot, the same subject’s maximum intensity projection PET shown beneath with a blue frame, and a green arrow pointing to the tumor. An obese representative subject is highlighted in the red the scatter plot, with his or her maximum intensity projection PET shown beneath with a red frame, and a green arrow pointing to the tumor. A two-sided Pearson correlation was performed, and statistical significance was determined as P < .05. SUL = standardized uptake value.

