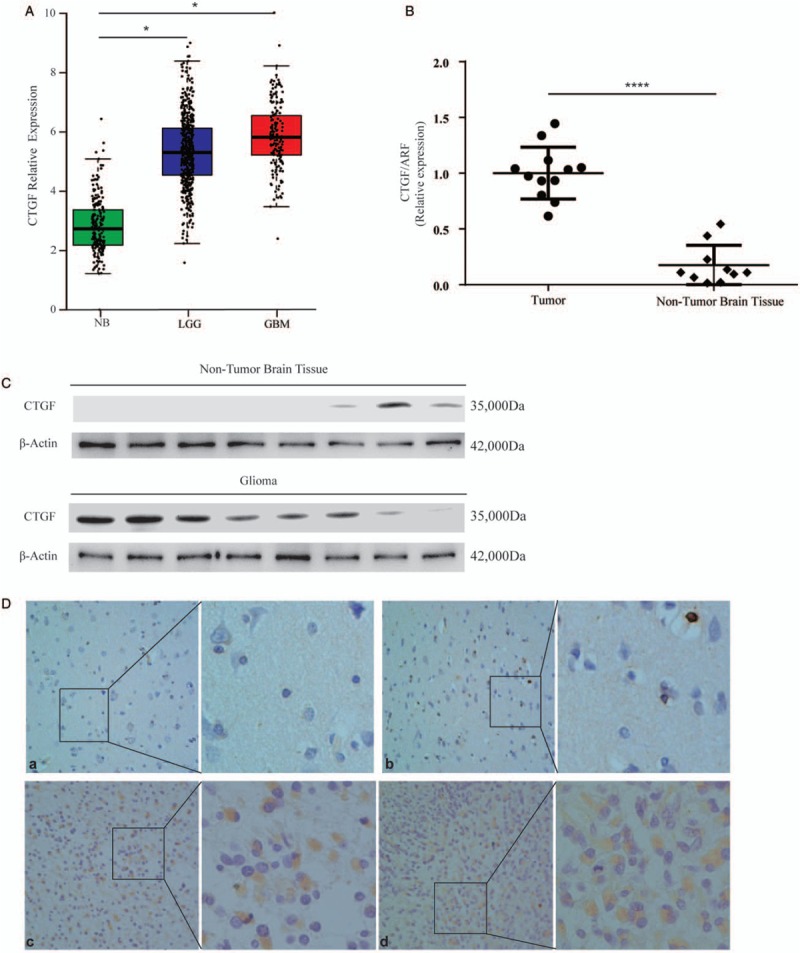
Figure 1.

The expression of CTGF in glioma and non-tumor tissue. (A) The expression of CTGF mRNA was increased in glioma compared with non-tumor tissues (GBM, n = 163; LGG, n = 518; NB, n = 207), analyzed with the web server GEPIA and expression data presented at mean ± SD from TCGA and GTEx (LGG, t = 2.410, GBM, t = 2.364, P<0.05). (B) The expression of CTGF mRNA was evaluated in 12 glioma tissues compared with ten non-tumor tissues by RT-PCR (t = 9.117, P < 0.0001). (C) The expression of CTGF protein was higher in eight glioma samples than eight non-tumor tissues by Western blotting. (D) The expression and location of CTGF were examined by Immunohistochemical staining. (a and b) weak staining of CTGF in normal tissues. (c and d) strong staining of CTGF in glioma tissues. Original magnification× 400. CTGF: Connective tissue growth factor; GBM: Glioblastoma; LGG: Lowly proliferative glioma; mRNA: Messenger RNA; NB: Non-tumor brain; RT-PCR: Reverse transcription-polymerase chain reaction; SD: Standard deviation.
