
Figure 2.
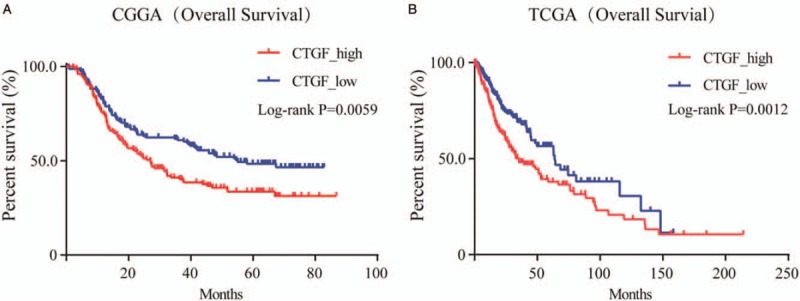
Kaplan-Meier survival analysis of OS based on the data collected from 301 patients in CGGA databases and 663 patients in TCGA databases. The log-rank test was used to calculate P values (CGGA: χ2 = 7.596, P = 0.0059; TCGA: χ2 = 10.46, P = 0.0012). CGGA: Chinese Glioma Genome Atlas; OS: Overall survival; TCGA: The Cancer Genome Atlas.