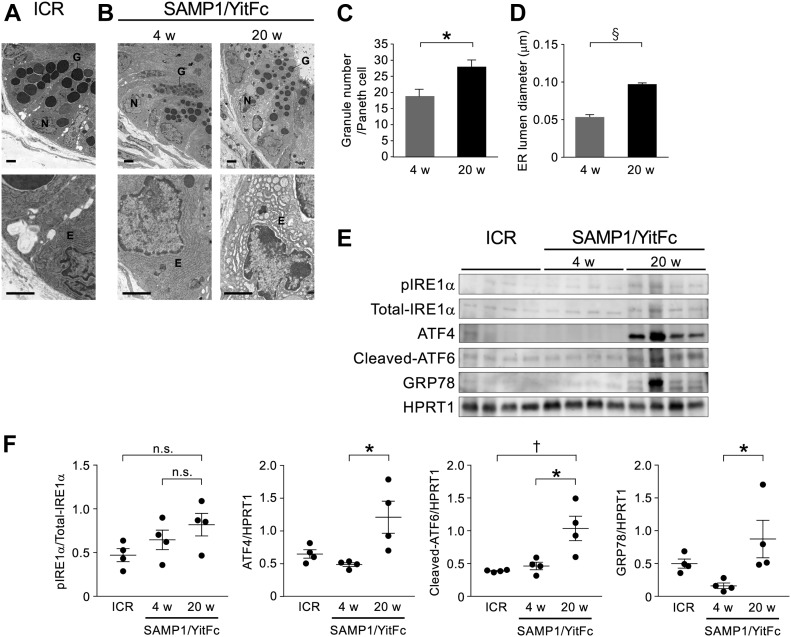
Figure 2. Abnormal Paneth cells show ER stress.
(A, B) Representative transmission electron microscopy images of Paneth cells at the base of ileal crypts in (A) ICR and (B) SAMP1/YitFc mice. Scale bars indicate 2 μm. (C, D) Quantitative analysis of (C) granule number and (D) ER lumen diameter in Paneth cells (n = 3/each week for SAMP1/YitFc mice). For the measurements, three Paneth cells were randomly selected from each mouse. (E) SDS–PAGE Western blot analysis of ER stress markers, pIRE1α, ATF4, cleaved-ATF6, and GRP78 in ileal crypts (n = 4/each group). Total-IRE1α and HPRT1 was used as loading control. (F) Relative expression level of ER stress markers calculated from the band intensity. Error bars represent mean ± SEM. (C, D, F) Statistical significance was evaluated by t test in (C, D), and one-way ANOVA followed by Tukey’s post hoc test in (F). P < 0.05 was considered statistically significant. *P < 0.05, †P < 0.01, §P < 0.001. E, ER; G, granules; N, nucleus; n.s., not significant.

