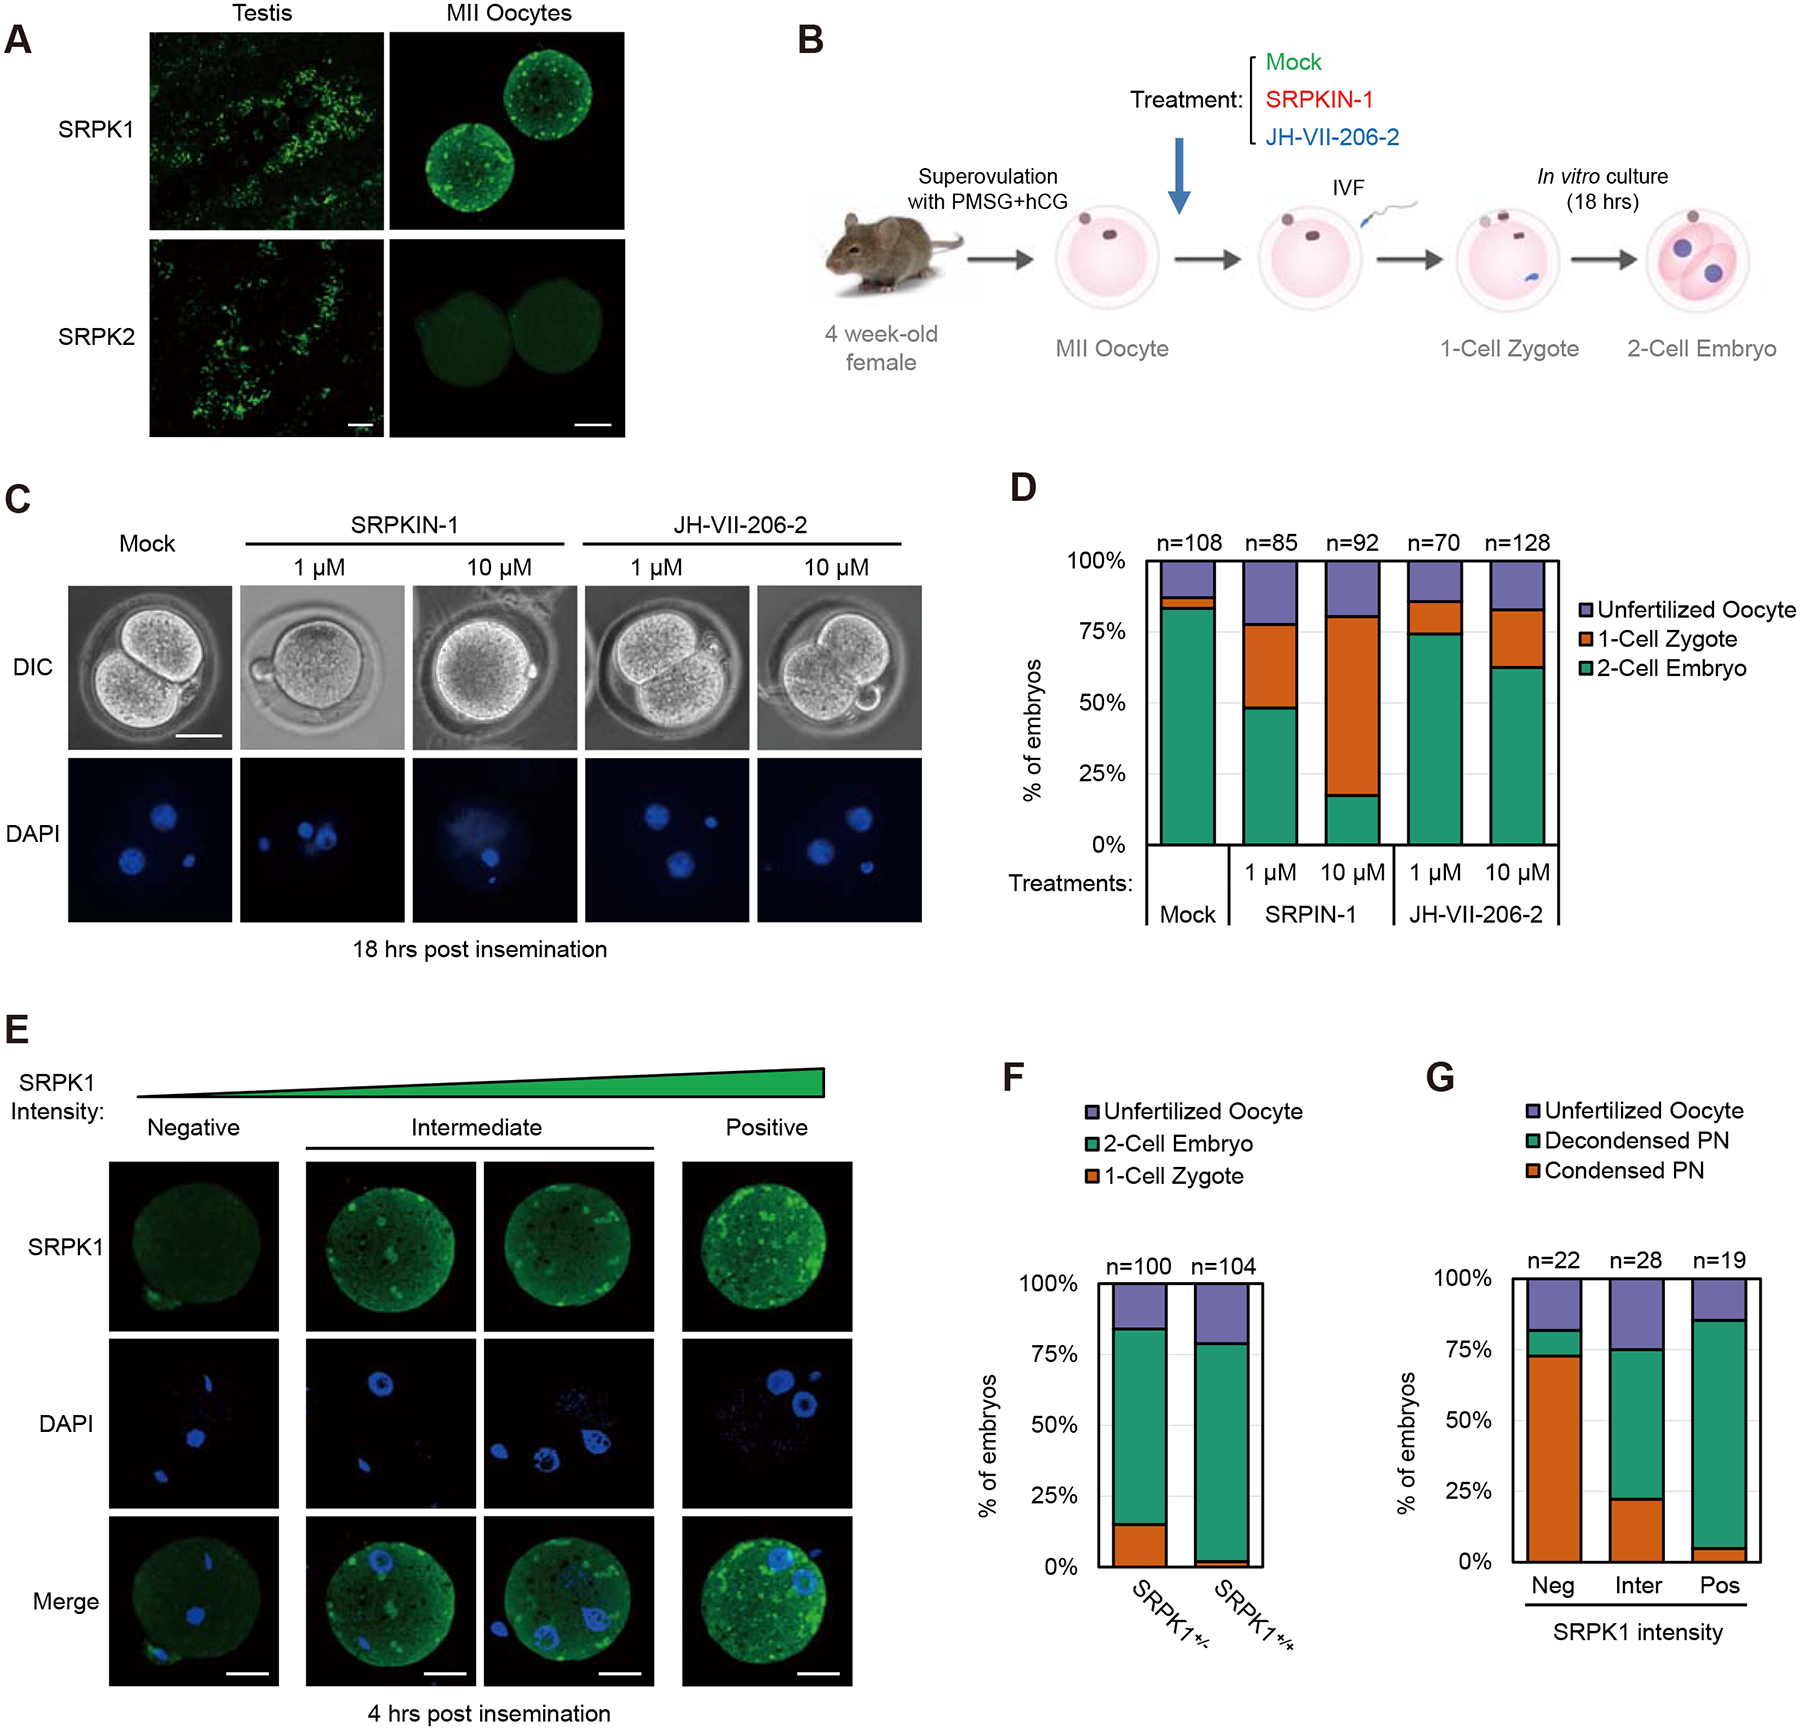
Figure 1. Inhibition of SRPK1 arrested fertilized oocytes at the 1-cell stage.

(A) Immunostaining of mouse testis and MII oocyte for SRPK1 and SRPK2. Scale bar, 20 μm. See Figure S1A for negative staining with anti-SRPK2 in comparison without primary antibody.
(B) Scheme for treatment with an SRPK1 inhibitor during in vitro fertilization (IVF). SRPKIN-1 is a specific SRPK1 inhibitor and JH-VII-206–2 is a compound with a related structure to SRPKIN-1 but without effect on SRPK1 kinase activity. See Figure S1B for compound structures.
(C) Representative images of chemically treated oocytes examined by differential interference contrast (DIC) microscopy (upper panel) or DAPI-stained DNA (lower panel). Maternal (M) and paternal (P) genomes are labeled.
(D) Quantification of unfertilized oocyte, 1-cell zygotes, and 2-cell embryos in response to treatment with the SRPK1 inhibitor or control compound. The numbers of zygotes quantified from three independent experiments are indicated above the bars.
(E) Representative images of zygotes with low, intermediate, and high levels of residual SRPK1 (quantified with ImageJ), correlated to different degrees of paternal genome decondensation. Scale bar, 20 μm.
(F and G) Quantification of unfertilized oocyte, 1-cell zygotes, and 2-cell embryos from fertilized oocytes in response to SRPK1 depletion (F) and percentages of the paternal genome that remained condensed in 1-cell zygotes relative to the remaining levels of SRPK1 (G). The numbers of zygotes quantified from three independent experiments are indicated above the bars. See also Figure S1C–F for additional details.
