
Figure 3. Maternal SRPK1 catalyzes site-specific phosphorylation of Protamine 1.
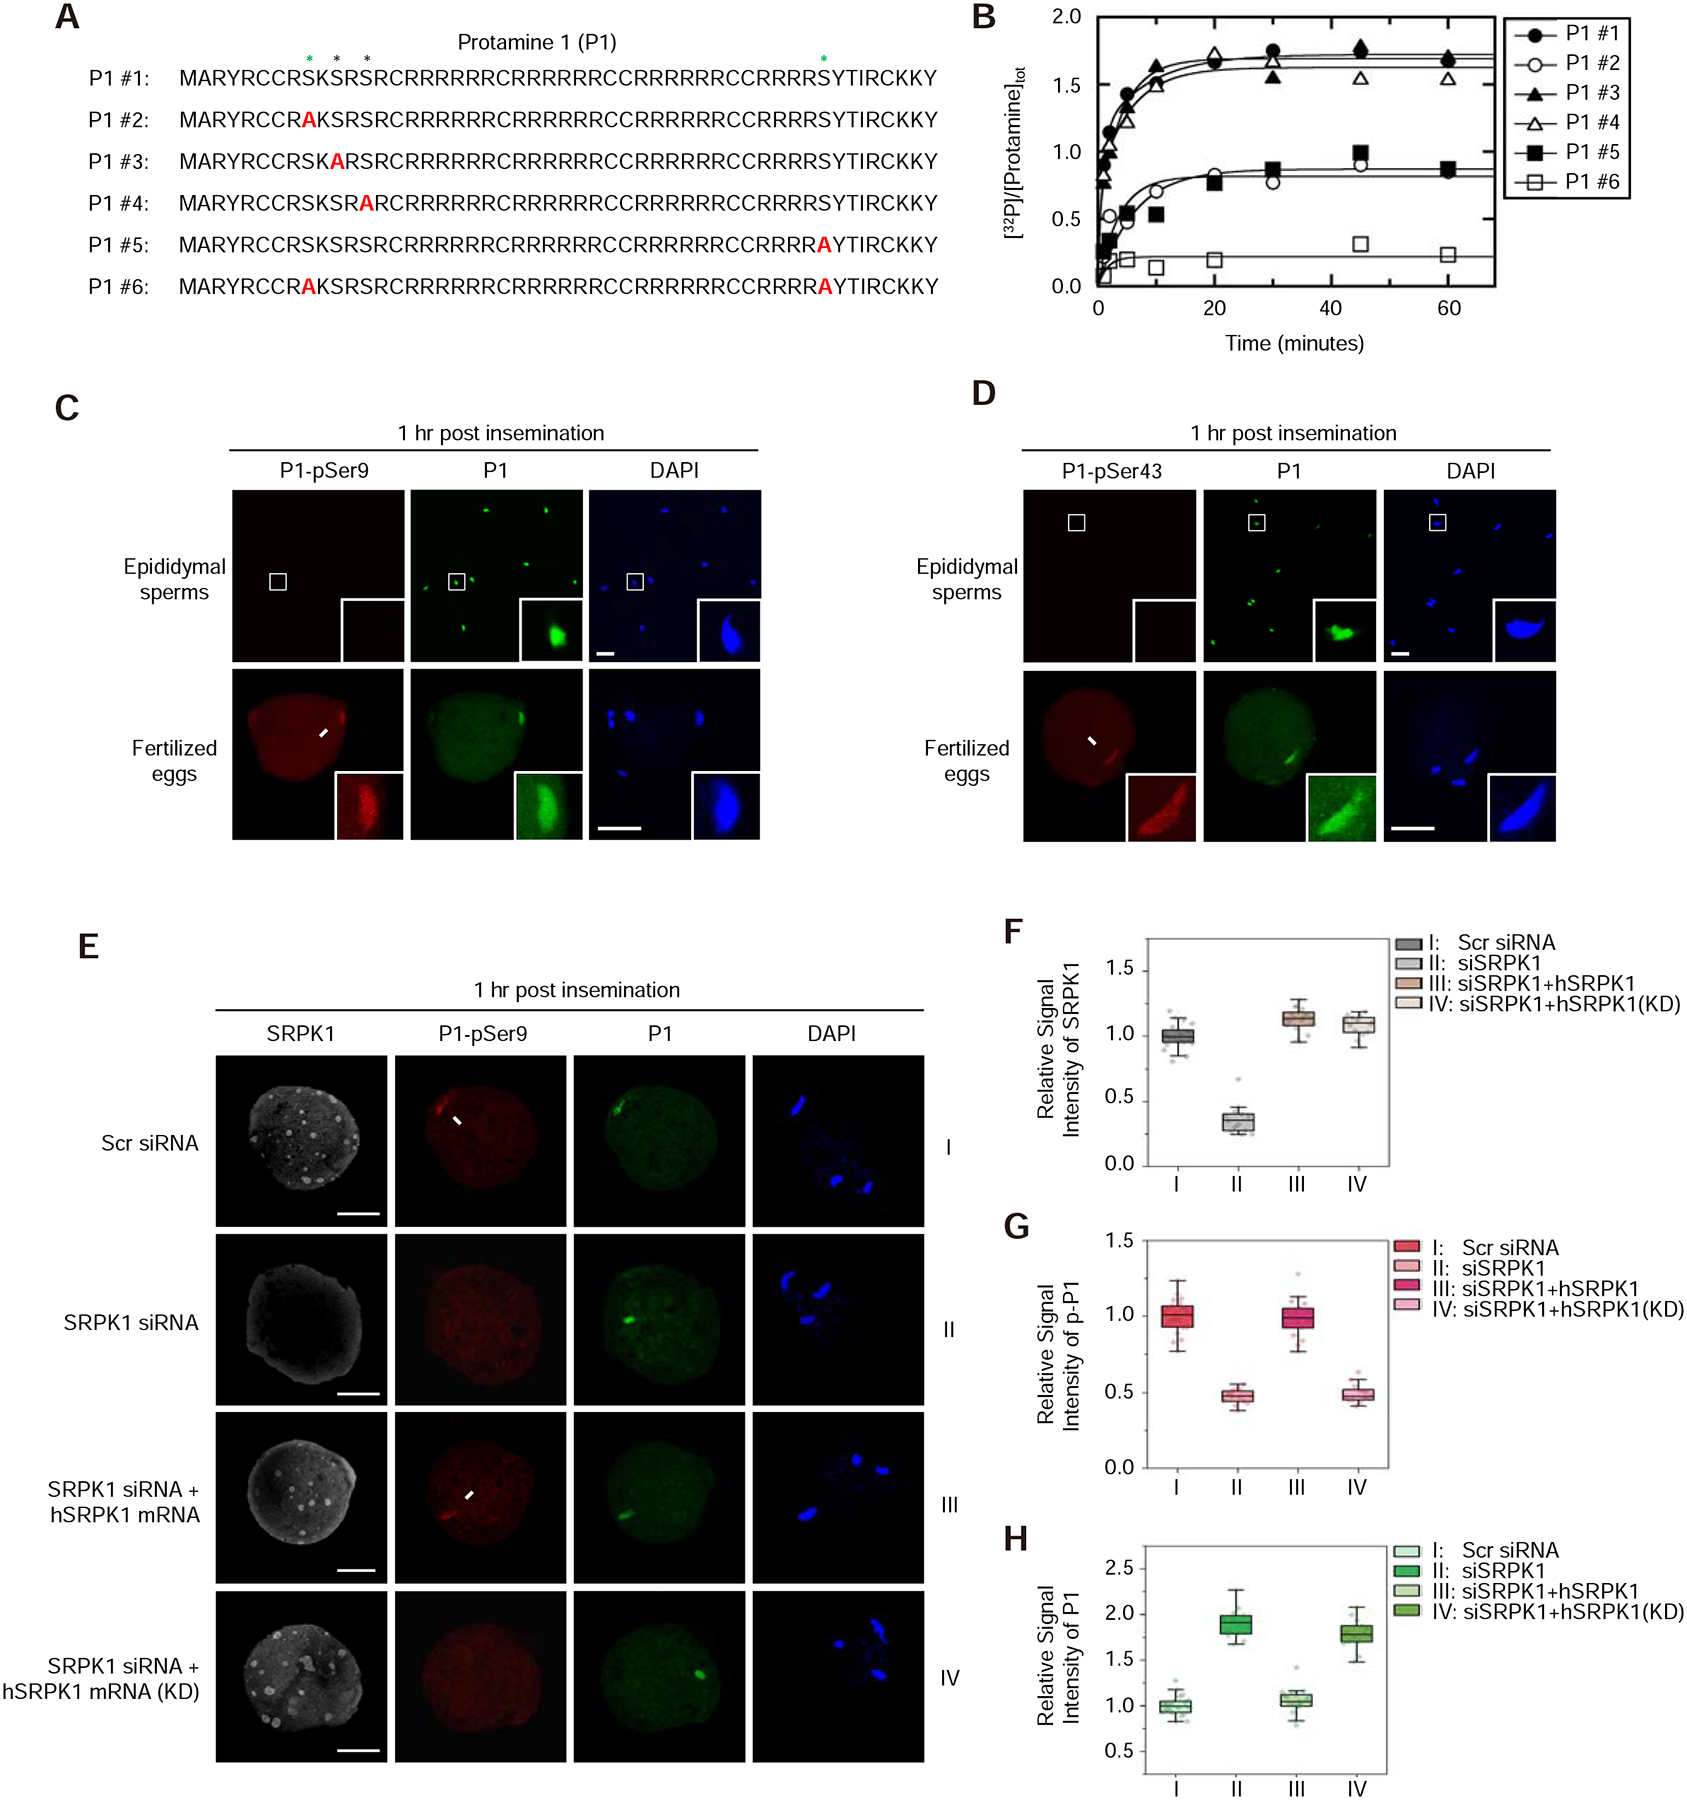
(A) The peptide sequence of mouse P1 (#1) and a series (#2 to #6) of peptides containing specific Ser-to-Ala mutations (red). See Figure S3A for 3 separately synthesized P2 peptides and mapped phosphorylation sites by SRPK1 in vitro.
(B) Time-dependent 32P-phosphate transfer to P1 by SRPK1. Data were fit to either single or double exponential function to obtain total phosphorylation content per peptide at reaction endpoints. See Figure S3B and C for the phosphoryl content transferred to P1 peptides by SRPK1 and the velocity of each phosphorylation reaction; see Figure S3D for SRPK1-catalyzed phosphorylation of individual P2 peptides.
(C, D) Immunostaining of total P1 (green) and phosphorylated P1 (red) at Ser9 (C) or Ser43 (D) in mouse epididymal sperms and zygotes 1-hour post insemination. Arrows indicate P1 on paternal DNA, each with a zoomed image in the insert. P, paternal DNA; M, maternal DNA; PB, polar body. Scale bar, 20 μm. See Figure S3E and F for characterizing the specificity of individual anti-P1 phospho-specific antibodies.
(E) Representative images of fertilized eggs treated with siSRPK1 or rescued with SRPK1 mRNA as in Figure 2B. See also Figure S3G for a time course experiment with anti-pSer43-specific antibody and Figure S3H for negative staining with anti-pSer11 and anti-pSer13 antibodies.
(F,G,H) Relative staining signals with anti-SRPK1 (F), anti-pSer9 (G) and anti-P1 (H) in fertilized eggs. The values of control zygote treated with Scr siRNA were set as 1.0 in each case. **P < 0.01 by two-tailed Student’s t-test; error bars, mean±SEM. See Figure S3I for a similar set of experiments with anti-pSer43.