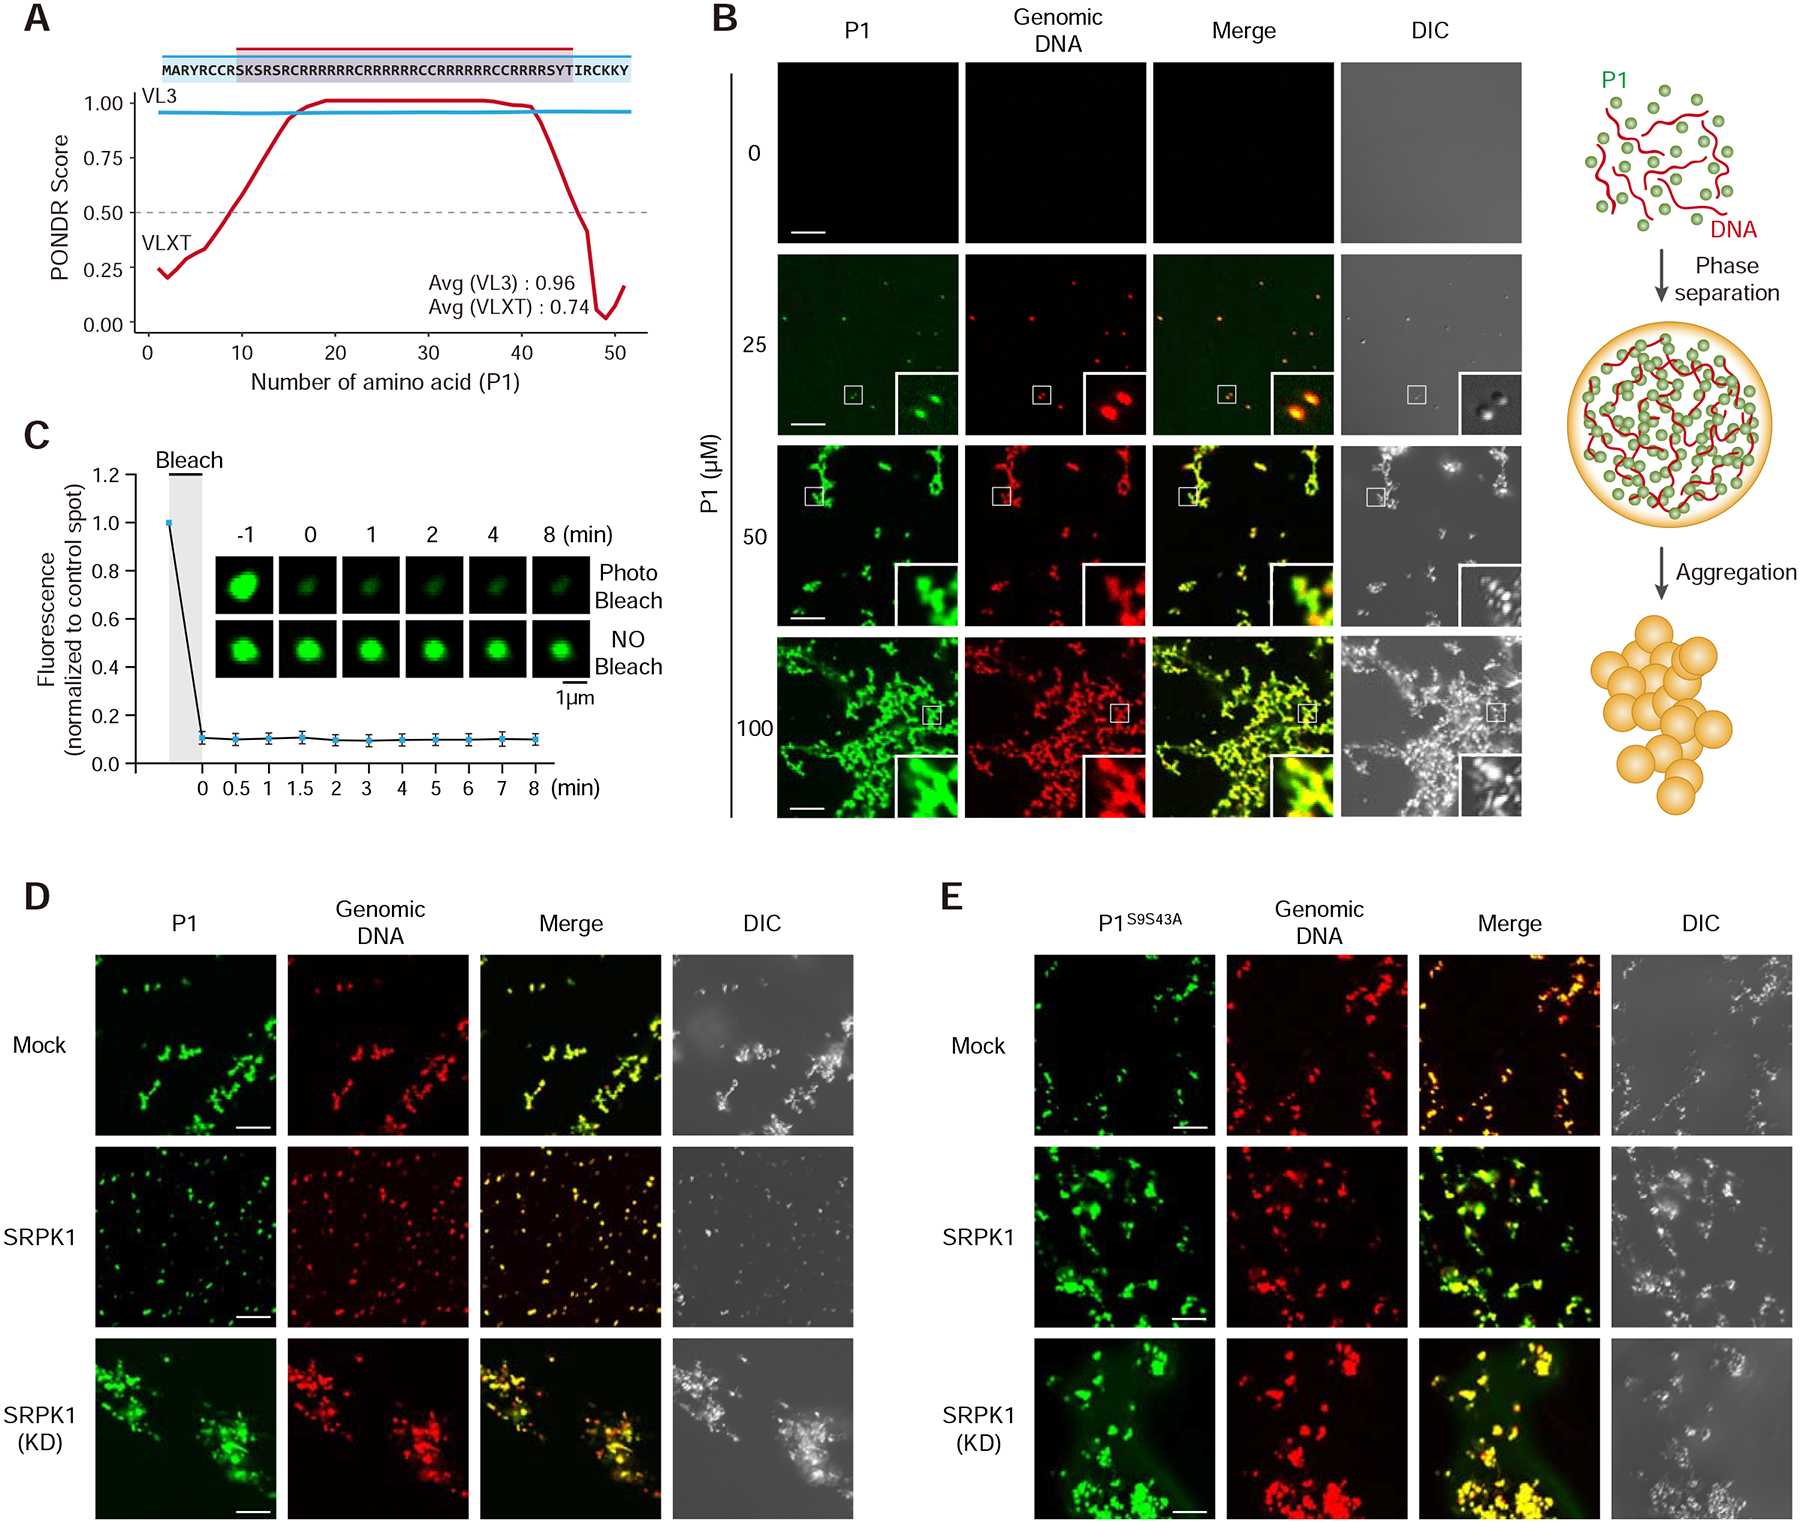
Figure 5. DNA-induced phase transition of Protamine 1 is partially reversed by SRPK1.

(A) Prediction of intrinsically disordered region (IDR) in P1. Note that the mapped SRPK1 phosphorylation sites are right on both edges of the IDR.
(B) P1 phase separation in the presence of DNA with increasing concentrations of P1 protein. 10% P1 was labeled with Alexa 488 and 1% DNA was labeled with Alexa 594. Insert: amplified images. Scale bar, 10 μm. See Figure S5A–C for protein concentration-dependent, but DNA length-independent P1 phase transition.
(C) Fluorescent recovery after photobleaching (FRAP) analysis on P1/DNA gel-like particles. Bleaching was performed at the indicated time points. Quantified data are based on 3 independent experiments. Error bars, mean±SEM.
(D,E) Representative images of wild-type (D) and double mutant (E) P1 phase separation in the presence of active or kinase dead SRPK1. See Figure S5D,E for similar analysis with single mutants in P1 phosphorylation sites.
