
Fig. 3. Examples of HGTs that occurred in limited CRASH species.
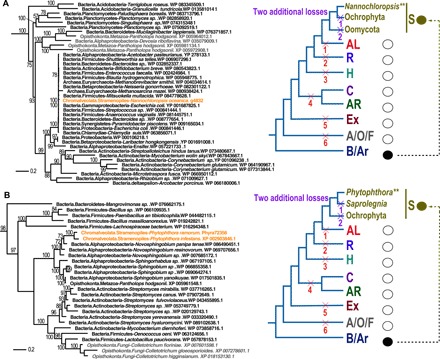
(A) Maximum likelihood tree of efflux MFS transporter Tet(C) gene. (B) Maximum likelihood tree of BchC. The inference of gene loss under the HGT and differential loss scenarios are as in Fig. 2. Eukaryotic sequences from CRASH are marked in orange, whereas the others are marked in gray.