
Fig. 5. Fluorescence investigation on the distribution patterns of the nanoformulation in 4T1 and A375 tumor–bearing nude mice.
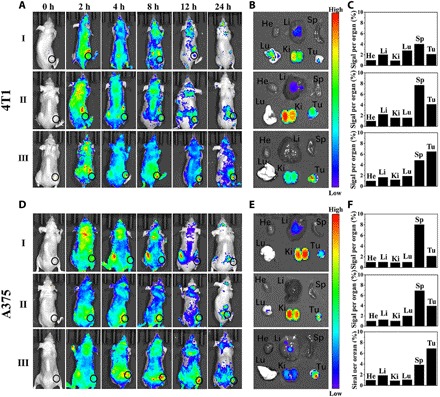
(A and D) Fluorescence images of the 4T1 and A375 tumor–bearing nude mice after the intravenous injection of Cy5 (I), ACC@Cy5-CaSi (II), and ACC@Cy5-CaSi-PAMAM-FA/mPEG (III) at different time points. (B and E) Ex vivo fluorescence images of organs and tumors harvested at 24 hours for mice bearing 4T1 or A375 tumors, respectively. (C and F) Quantitative analysis on the MFI (mean fluorescence intensity) of major organs and tumors in mice bearing 4T1 or A375 tumors, respectively. Data were collected 24 hours after intravenous injection.