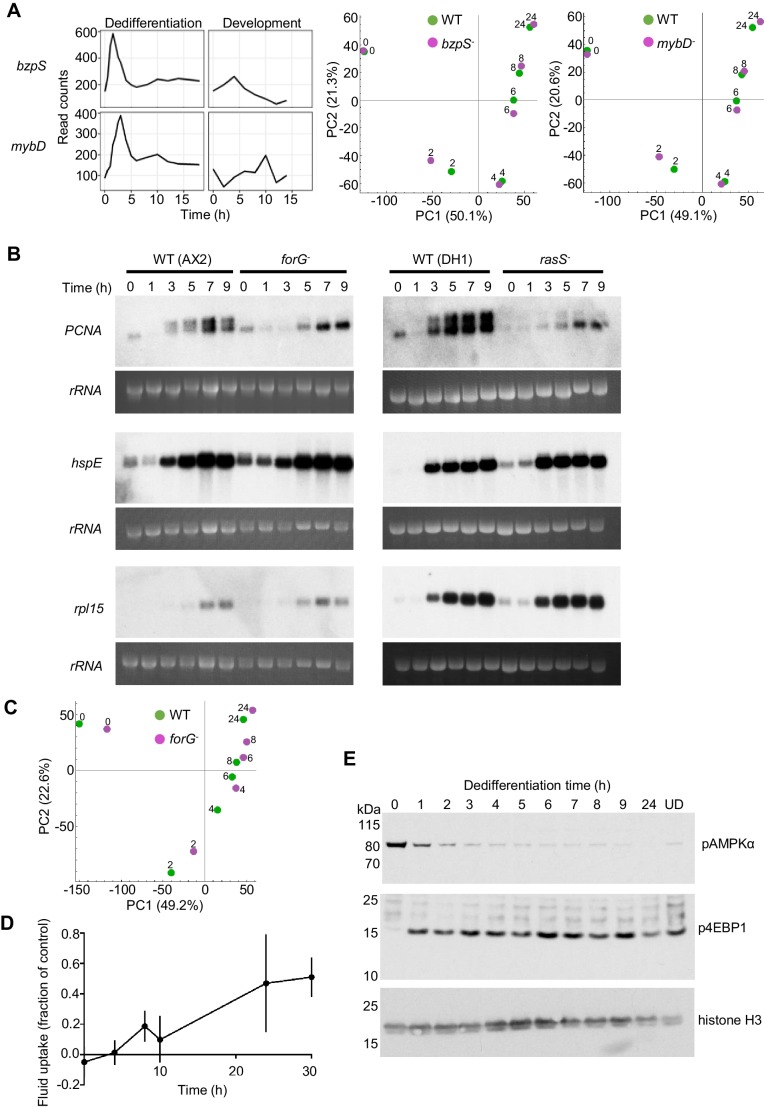
Figure 3. Molecular regulation of dedifferentiation.
(A) Testing the importance of transcription factors expressed early in dedifferentiation. Expression of bzpS and mybD during dedifferentiation in liquid medium alongside their developmental profiles (left). Right: PCA of transcriptome changes during dedifferentiation of wild type and bzpS and mybD mutants. See Table 1 for details of additional mutants. (B) Disrupted gene expression during dedifferentiation in forG- and rasS- mutants. Northern blots of PCNA, HspE and Rpl15 expression during dedifferentiation in wild-type, forG- and rasS- cells, with RNA loading indicated by 26S rRNA. PCNA blots representative of three experiments. (C) PCA of transcriptome changes during the dedifferentiation of forG- and wild-type cells. PCA carried out on the mean read counts of two biological replicates. (D) Onset of fluid uptake during dedifferentiation of wild-type (AX2) cells in liquid medium, measured as a fraction of the fluid uptake by undifferentiated cells. Data are the mean and SD of four replicates, except for 30 hr, with three replicates. (E) Rapid changes in phosphorylation of nutrient response markers during dedifferentiation in liquid culture. Phospho-western blotting of AMPKα and 4E-BP1 phosphorylation. UD = undifferentiated cell sample. Equal amounts of protein loaded, with histone H3 used as a standard (three replicates).


