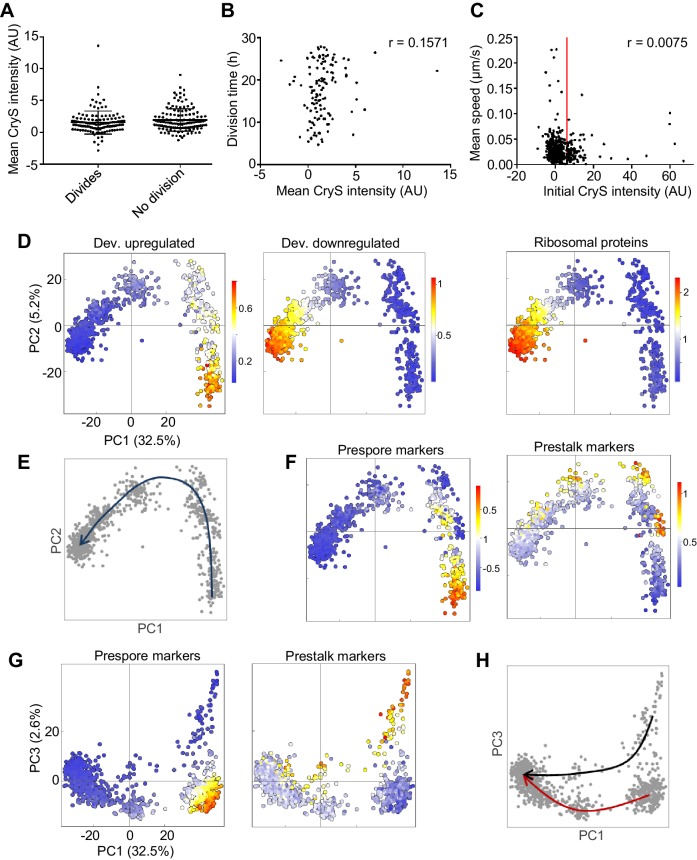
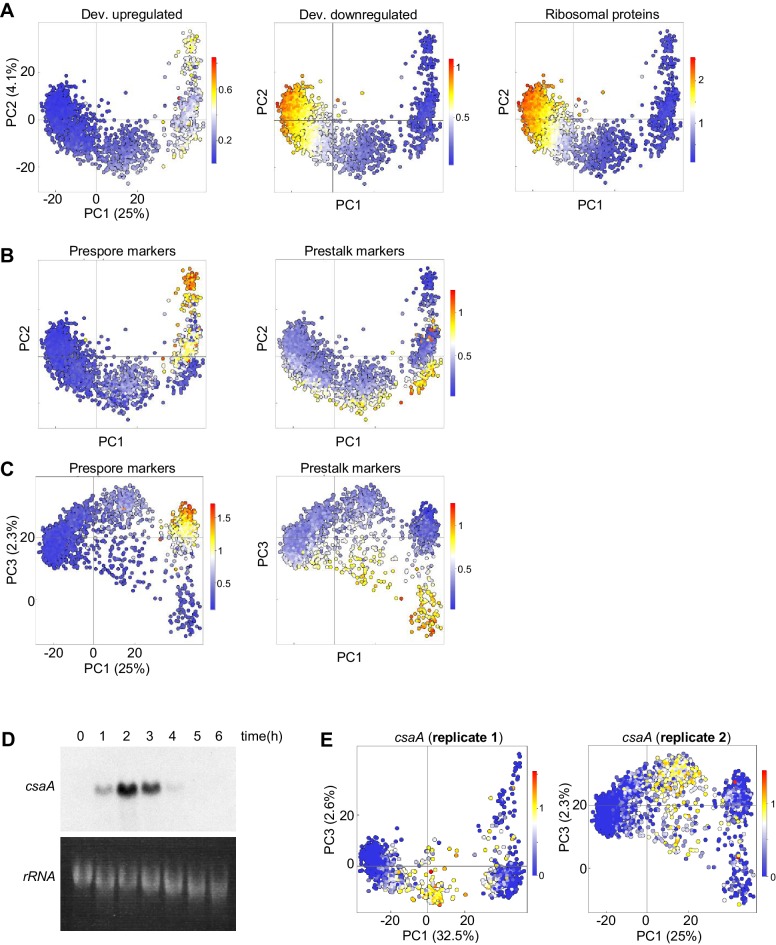
Figure 6. Rapid convergence of dedifferentiation trajectories.
(A) The expression of the prestalk reporter (CryS-mNeonGreen) does not predict division probability during dedifferentiation. Reporter intensity at the beginning of dedifferentiation shows no significant difference between dividing and non-dividing cells (KS test p=0.134). Plots show mean and SD. One of two replicates shown (261 cells). (B) Initial fate and division time are not related. Relationship between initial CryS intensity and division time during dedifferentiation. One of two replicates shown (n = 124 divisions, r = 0.0864 mean of replicates). (C) Initial fate and motility are not correlated. Relationship between initial CryS expression and speed during the first 4 hr of dedifferentiation (442 cells). Vertical line indicates 80th percentile of CryS:mNeonGreen intensity. Mean r for two replicates = 0.0481. (D) Expression of different gene sets during dedifferentiation in 925 single cells (experimental replicate shown in Figure 6—figure supplement 1). PCA of scRNAseq overlaid with expression of a set of 303 developmentally induced genes (left panel), 276 genes turned off during development (centre panel) with 81 ribosome protein genes also shown (right panel). Each dot represents a cell. Cells were pooled from samples taken each hour during dedifferentiation (0–6 hr). (E) Schematic of the inferred path of cells during dedifferentiation. (F) Cell type specific gene expression during dedifferentiation. The same PCA plots as in D, but overlaid with the expression of sets of 42 prespore or 48 prestalk genes. (G) Cell type specific expression is more clearly delineated by PC3. The same expression data as in F plotted in PC1/PC3 space. (H) Convergence of cell type specific gene expression trajectories during dedifferentiation. Same plot as G, highlighted to show the inferred trajectories of cells with different starting fates. PCA colour scale indicates mean of log10 counts.


