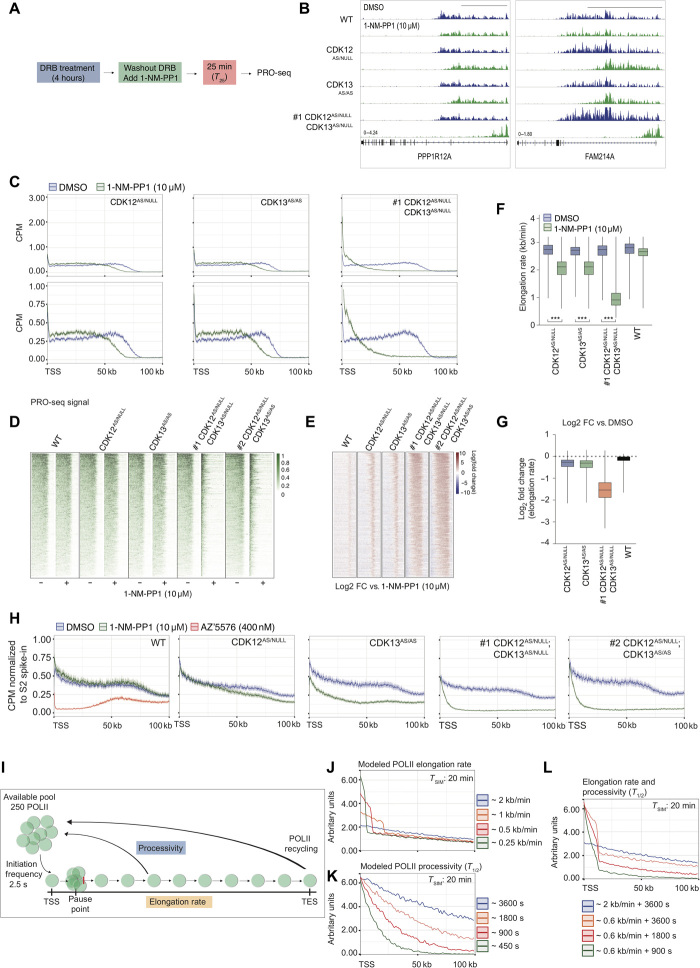
Fig. 4. Perturbation of POLII transcription cycle at the elongation checkpoint by dual CDK12 and CDK13 inhibition.
(A) Schematic overview of DRB-release PRO-seq assay for (B) to (G). (B) Representative IGV images for DRB-release PRO-seq of MV4;11 WT and AS clones treated with 10 μM 1-NM-PP1. Scale bars, 50 kb. (C) Average gene profiles for DRB-release PRO-seq analysis of 368 genes in MV4;11 AS clones treated with 10 μM 1-NM-PP1. Heat map analysis of (D) PRO-seq signal and (E) log2FC PRO-seq signal (DMSO relative to 1-NM-PP1) in MV4;11 WT and AS clones treated with 10 μM 1-NM-PP1. (F) POLII elongation rate and (G) log2FC in POLII elongation rate (relative to DMSO) in MV4;11 WT and AS clones treated with 10 μM 1-NM-PP1. (H) Average gene profiles for TT-seq analysis of 368 genes normalized to Drosophila S2 RNA spike-in in MV4;11 WT and AS clones treated as indicated for 25 min. (I) Schematic overview of POLII elongation rate and processivity computational modeling parameters. Computational modeling of simulated defects in POLII (J) elongation rates, (K) processivity half-life (T1/2), and (L) combined elongation and processivity. (F) and (G) are representative of 368 genes, and Student’s t test was performed for (F) (***P < 0.001).

