. 2020 Apr 29;9:e53916. doi: 10.7554/eLife.53916

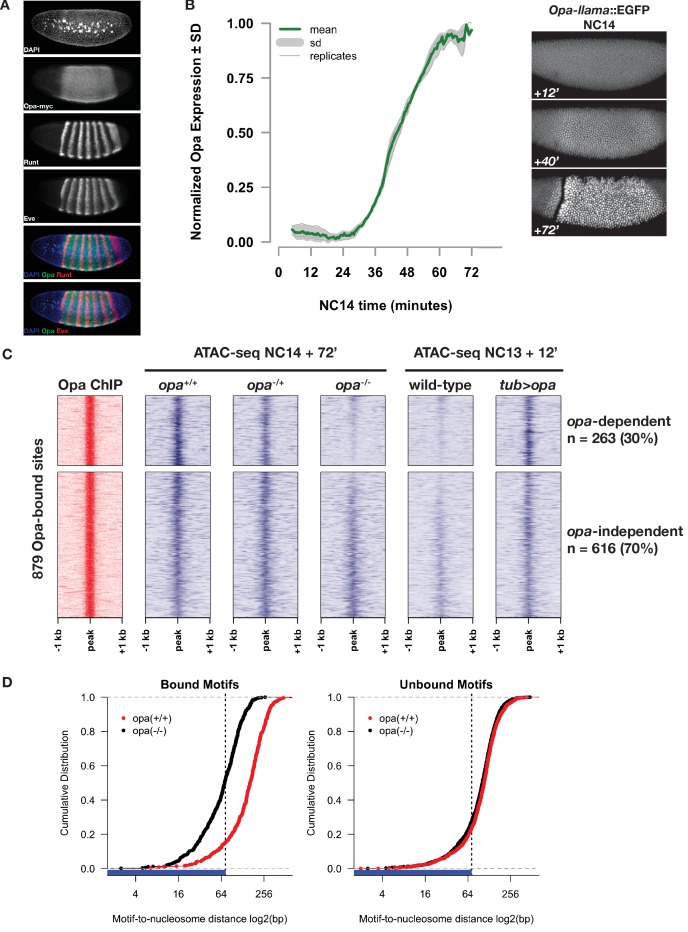
Figure 5. Opa is necessary and sufficient to pioneer accessible chromatin.

(A) Immunostaining for myc-tagged Opa expression relative to expression of pair-rule genes Runt and Eve in a late NC14 embryo. (B) Opa expression dynamics were measured using a llama-tagged opa allele. Opa expression initiates midway through NC14 and reaches steady levels by entry into gastrulation at 65 min. Images show representative expression of opa-llama::EGFP at the indicated timepoints. (C) Heatmaps showing scaled ATAC-seq accessibility measurements (blue) over a set of high-confidence Opa binding sites, as determined by ChIP-seq for Opa-myc (red). Two experiments are shown, for loss of function at NC14 + 72’, and gain of function at NC13 +12. Loss of blue signal indicates a reduction in accessibility. (D) Cumulative distribution of measured of distances between bound (left) or unbound (right) Opa motifs and modeled nucleosome dyad positions, in the absence (black) or presence (red) of Opa. X-axis is log2 scaled, and the expected coverage of a nucleosome is depicted by the blue rug and vertical dotted line. See also Figure 5—figure supplements 14.

Figure 5.

Figure 5—figure supplement 1. Comparison of RNA Pol two distribution over the opa and ftz loci.
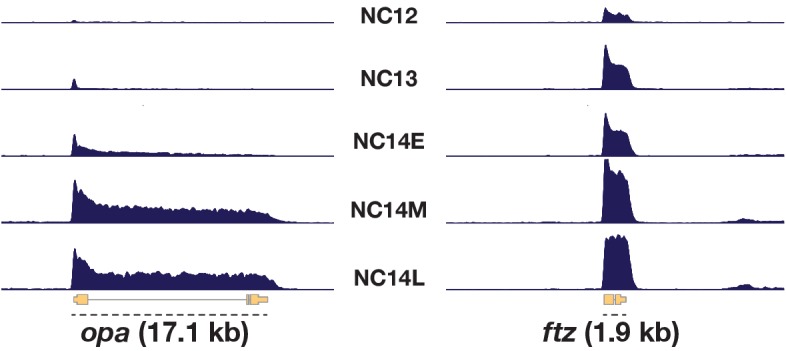
Figure 5—figure supplement 1.

RNA Pol2 ChIP-seq coverage measurements over the opa (left) and ftz (right) loci are shown from NC12 through NC14 Late (E = early, M = mid, L = Late). x-axes (genomic ranges) for both plots are identical, and highlight the difference in gene size between opa and ftz. y-axes are scaled identically across both loci and timepoints and can be compared directly. RNA Pol 2 ChIP-seq data is from Blythe and Wieschaus (2015).
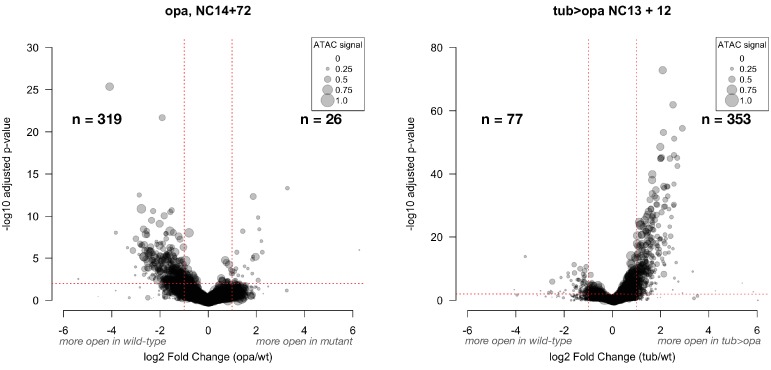
Figure 5—figure supplement 2. Effect of opa loss- and gain-of-function across all ATAC peaks.

Figure 5—figure supplement 2.

These volcano plots show the effect size for opa loss- and gain-of function experiments over the entire set of ATAC peaks (n = 26328 peaks). The plot on the left shows the effect of opa loss of function on chromatin accessibility. The number of peak regions above significance (0.01) and log2 fold-enrichment (1) thresholds is indicated in bold for each condition. Point sizes are scaled to the distribution of mean ATAC signal for the represented peak (large dots = larger ATAC signal).
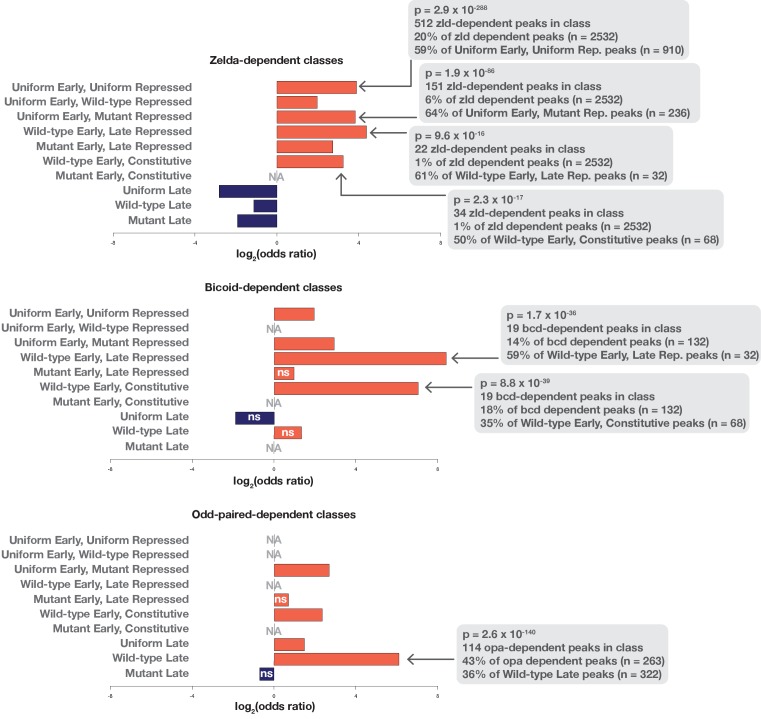
Figure 5—figure supplement 3. Enrichment of Zld, Bcd, and Opa dependence in accessibility classes.

Figure 5—figure supplement 3.

The set of ATAC-peaks showing dependence on either Zld, Bcd, or Opa were calculated by DESeq2. ATAC seq data for bcd and zld mutant embryos was from Hannon et al. (2017). ‘NA’ indicates that none of the tested pioneer dependent peaks were found to overlap the associated peak class. Bcd and Zld-dependent regions are enriched for classes with early accessibility. Opa is enriched in the wild-type late class. Two-tailed fisher’s exact p-values and numbers are provided for select classes where motif enrichment was observed. ‘ns’ indicates that the Fisher’s exact p-value for the associated comparison was greater than 0.05.
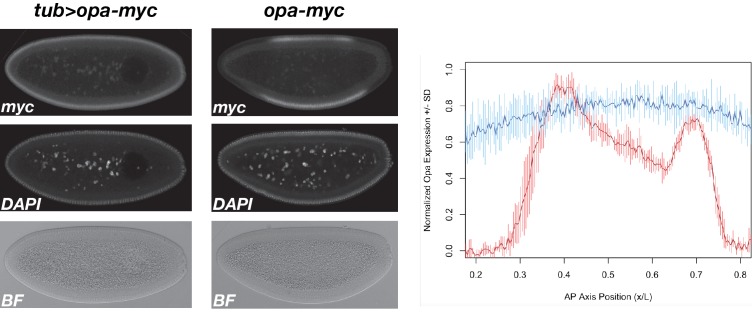
Figure 5—figure supplement 4. Expression of tub >opa compared with wild-type opa.

Figure 5—figure supplement 4.

Embryos expressing either tub >opa-3xMyc or wild-type opa-3xMyc were mixed prior to fixation and immunostained together for myc and counterstained for DNA (DAPI). Stained embryos were mounted and imaged in a single confocal session. Representative tub >opa-3xMyc and opa-3xMyc embryos are shown (left and center, respectively). Staining intensity from three stage-matched embryos from each genotype was quantified and plotted as a function of AP axis position. Average wild-type expression ±st. dev. (n = 3 embryos) is plotted in red. Tub >opa expression±st. dev. (n = 3 embryos) is plotted in blue. Note, for presentation, certain images were rotated from their original positions and missing background pixels were filled in. No pixels corresponding to the embryo were altered.