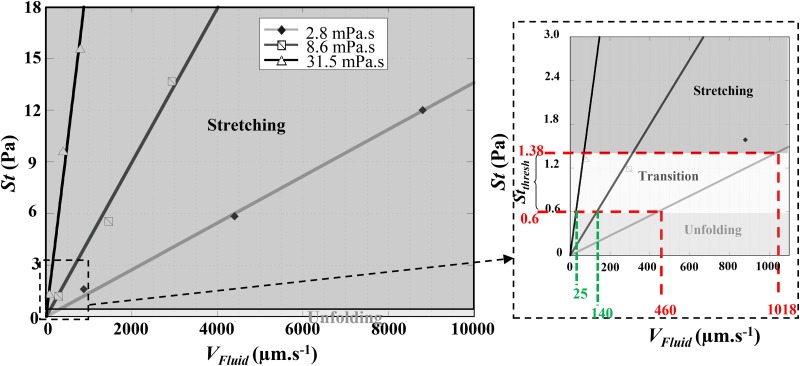
FIG. 6.
Representation of the estimated applied stress at the exit of the last geometrical constriction vs the flow velocity at this location and the external medium viscosity showing the two behaviors regions (unfolding/stretching) as well as the threshold stress . The inset shows a close-up on the origin of the plot. The gray zone represents the transition zone. Numerical simulations were performed using m.

