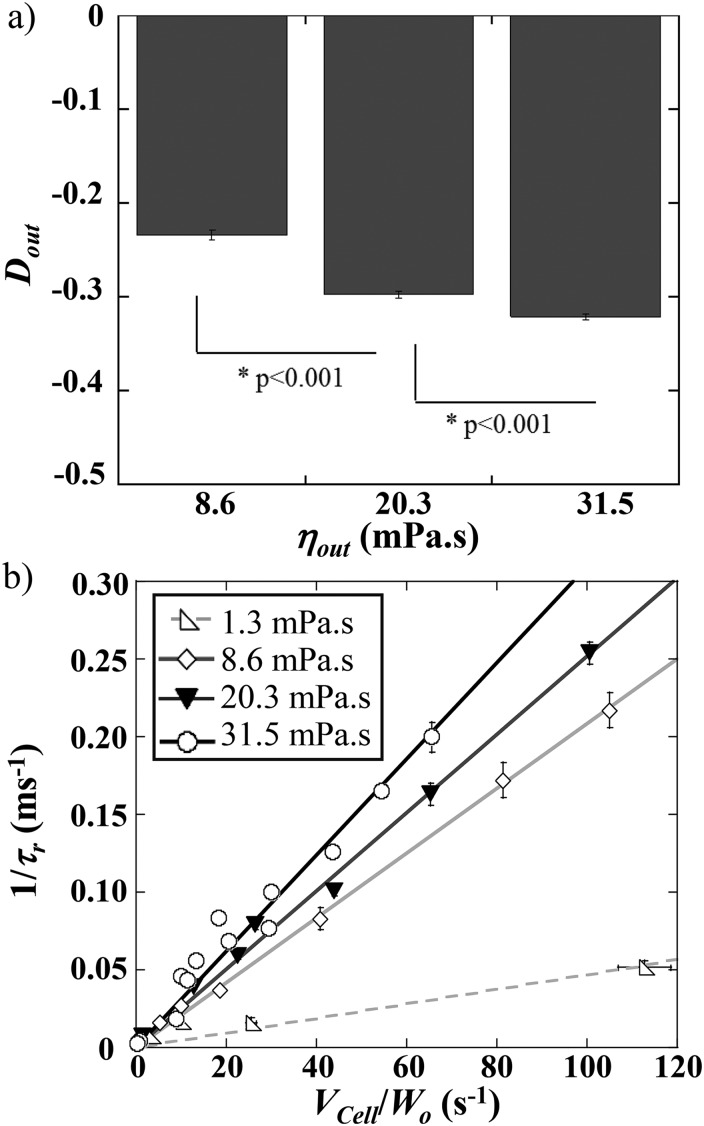
FIG. 8.
(a) Evolution of vs the external medium viscosity, , for m. The data have been obtained by pooling the various conditions for each in the stretching mode. (b) 1/ as a function of /, for various conditions of . Each point represents a statistic of at least 20 RBCs. P represents the P-value of the t-test.

