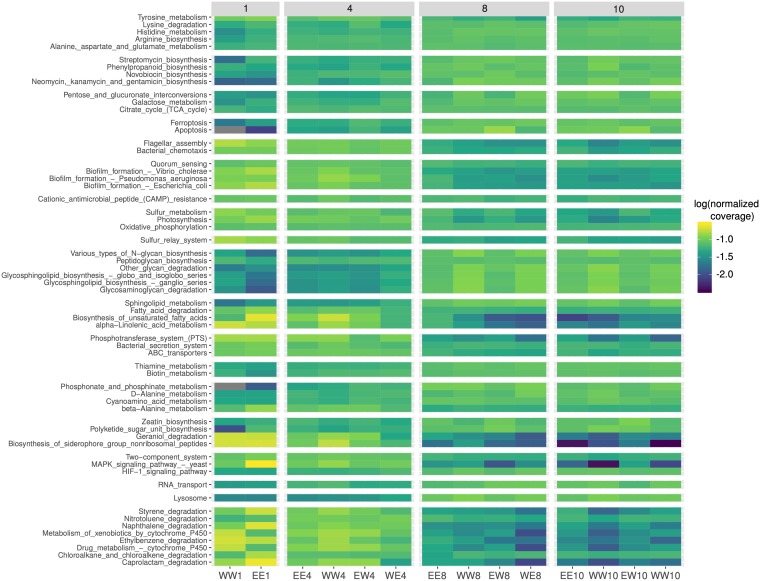
FIG 6.
Selected KEGG pathways displaying significant differential relative abundance across the course of decomposition. Pathways were selected that had an unadjusted P value of <0.03 after a Kruskall-Wallis test comparing decomposition time (1, 4, 8 , and 10 days). Shown is the log10 value of the fractional coverage of the pathway with respect to the total coverage across all the pathways in the sample. Total pathway coverage is also proportionally normalized across every sample. Note that some pathways are based on a few representative genes. For example, coverage of the photosynthesis pathway is mainly derived from genes encoding sodium ion pumps.

