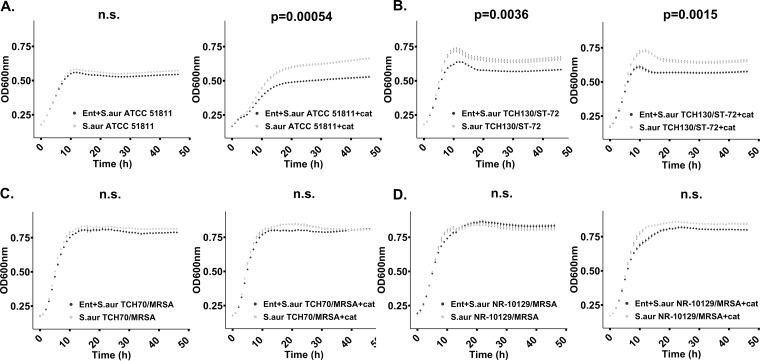
FIG 7.
Reduced growth of Staphylococcus aureus incubated in liquid M9 growth medium (100 μM enterobactin, 8 μg/ml catalase, 100 mM glucose) at 37°C for 24 h. No enterobactin was added to the control samples. Growth curves in black represent cultures amended with enterobactin. Statistically significant growth curves (P < 0.05) are shown with corresponding P values. Error bars reflect the standard error of the mean (calculated from triplicates). (A) Growth of S. aureus strain 51811 with enterobactin only (left panel) and with enterobactin and catalase (right panel). (B) Growth of S. aureus strain TCH130/ST-72 with enterobactin only (left panel) and with enterobactin and catalase (right panel). (C) Growth of S. aureus TCH70/MRSA with enterobactin only (left panel) and with enterobactin and catalase (right panel). (D) Growth of S. aureus NR-10129/MRSA with enterobactin only (left panel) and with enterobactin and catalase (right panel). Graphs were generated and statistically validated using R Studio and the “statmod” and “ggplot2” packages (48–50).

