
Figure 2. Characterization of cell metabolism and αSMA and vimentin expression of iMSCs when seeded on PCL-MAA and PCL.
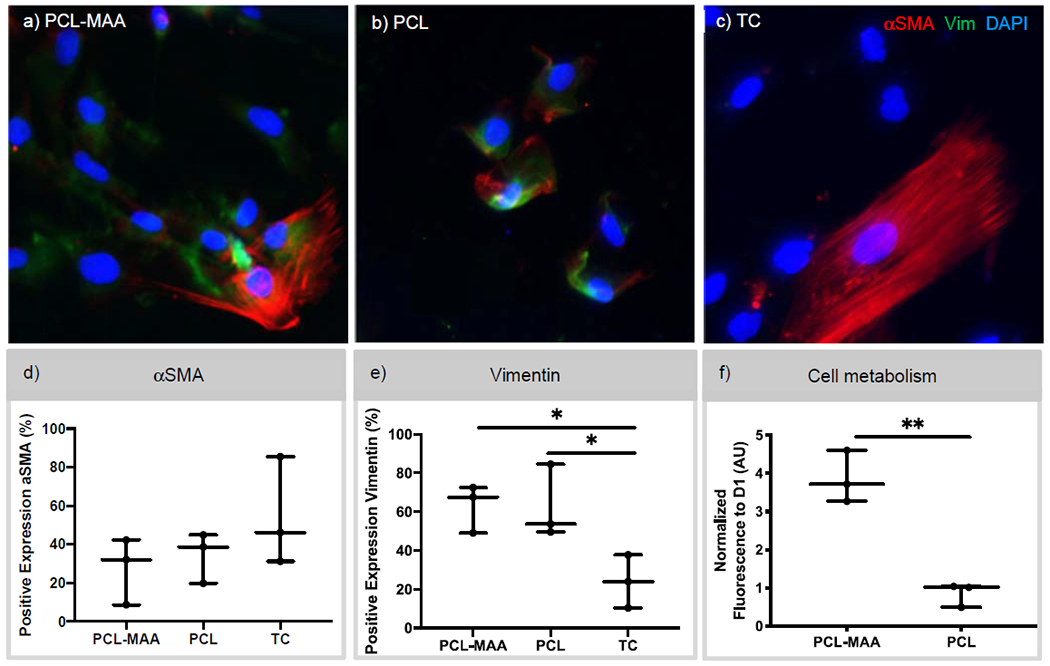
a-c) Immunostaining of αSMA and vimentin expression of iMSCs seeded on PCL-MAA, PCL, and tissue culture (TC) after 7 days. d,e) The percentage of cells that stained positive for αSMA and vimentin was quantified from immunostaining images using CellProfiler software and a one-way ANOVA used. N = 3. DAPI – blue, vimentin – green, and αSMA – red. Scale bar 50 mm. f) Cell metabolism of iMSCs seeded on PCL-MAA and PCL scaffolds was determined via alamarBlue assay. The level of fluorescence for cell metabolism was normalized to D1 and an unpaired t-test was used for statistical analysis. N=3. *p<0.05; **p<0.01.